Figure 2.
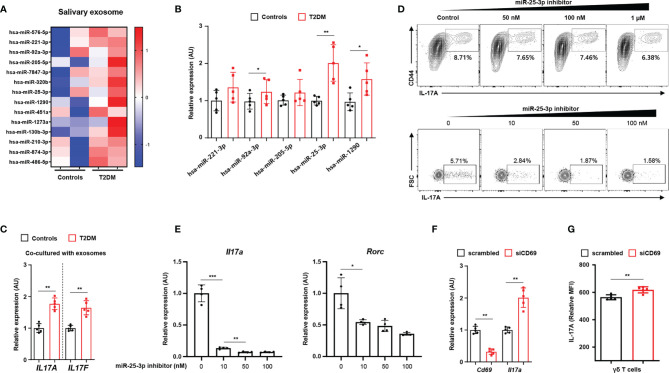
Salivary exosomal miRNA profiles in healthy individuals and in patients with type 2 diabetes. (A) Heatmap showing differentially enriched miRNAs in salivary exosomes from patients with type 2 diabetes as compared with those from normoglycemic healthy individuals. (B) Expression of differentially enriched miRNAs in salivary exosomes was measured by real-time PCR. (C) Co-culturing γδ T cells with salivary exosomes (from either healthy individuals or patients with type 2 diabetes) with anti-CD3 (2 μg/mL), anti-IL-2 (10 ng/mL), and isopentenyl pyrophosphate (5 μg/mL). (D) The population of IL‐17A-producing cells under culture conditions of γδ T cell activation at the indicated concentrations of miR-25-3p inhibitors. (E) Transcription of Il17a and Rorc in differentiated CD4+ T cells under TH17 differentiation-inducing culture conditions at the indicated concentrations of miR-25-3p inhibitors. (F, G) γδ T cells were transfected with either control siRNA or anti-CD69 siRNA for 48 hr. Expression levels of IL-17A were measured by using qPCR and FACS analysis. Data represent mean values of more than three independent experiments. Data are expressed as the mean ± SEM. *p < 0.05, **p < 0.01, ***p < 0.001 (B, C, F, G), two‐tailed t tests; (E), one‐way ANOVA.

