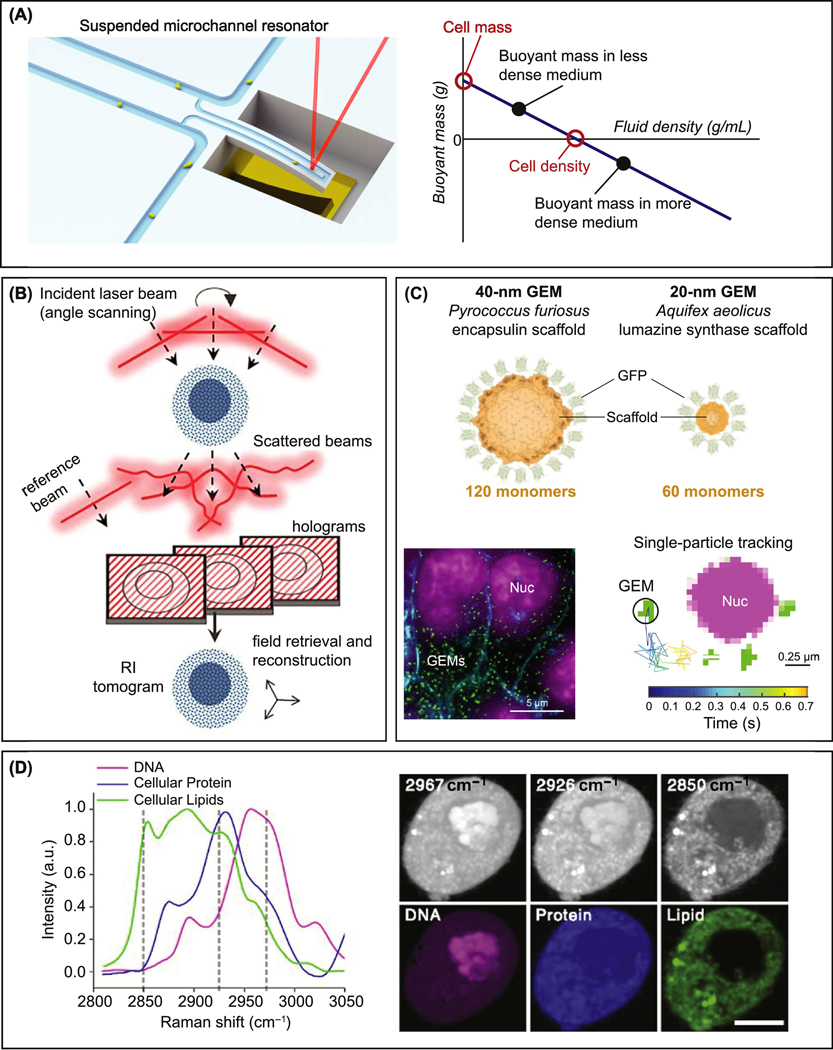
Figure 1: Methods to measure cell density.
(A) Left: Cartoon of a suspended microchannel resonator. The vibration frequency of the cantilever is measured with a laser (red line) and changes as a cell passes through the microchannel. Right: Graph illustrating how buoyant mass measurement in two fluids of different density allows for the determination of absolute cell mass and density. (Image credit: Francisco Feijo Delgado & Scott Manalis, Koch Institute Image Gallery, Collection: Image Awards 2011. Graph adapted with permission from [15])
(B) Schematic overview of refractive index tomography: A specimen is illuminated from different angles. The phase information is retrieved from the acquired holograms and used to construct a 3D tomograph of the refractive index inside the specimen (Figure adapted with permission from [18]).
(C) GFP tagged encapsulin and lumazine synthase scaffold proteins self-assemble into spherical particles of a stereotypical size. Measuring particle displacement over time in live cells yields information about cytoplasm or nuclear density. GEM: Genetically encoded multimeric nanoparticle. Nuc: Nucleus (Figure adapted with permission from [20])
(D) Left: Raman spectra of DNA, protein and lipids extracted from HeLa cells. Right: Images acquired using stimulated Raman scattering microscopy at the wabelengths indicated in the Raman spectra before (top) and after (bottom) spectral unmixing (Figure adapted with permission from [39]).

