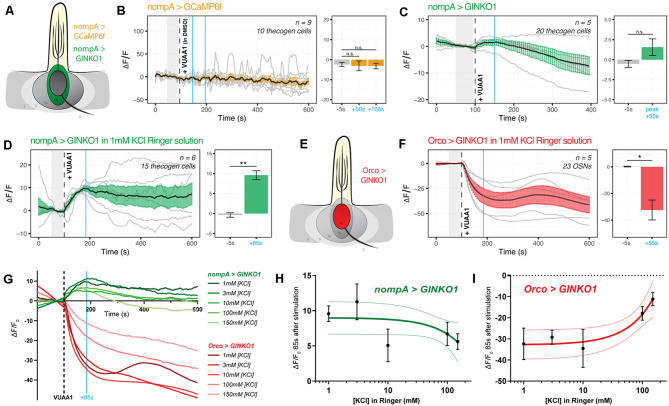
Figure 4.
Cation dynamics in thecogen cells during odorant presentation. Thecogen cells are targeted for cation imaging using nompA-GAL4. (A) Imaging paradigm for Ca2+ and K+ in thecogen cells. Both Ca2+ and K+ cation reporters are expressed using the GAL4/UAS system in a nompA promoter-driven manner. (B) Live time course for Ca2+ imaging during VUAA1 stimulation. No net change in cytoplasmic Ca2+ in thecogen cells is evident following VUAA1 treatment (This also constitutes a lack of response for the intermediate solvent of VUAA1, DMSO.) (C) Live time course for K+ imaging using GINKO1 during VUAA1 stimulation. A small increase in intracellular K+ concentration is observed. (D) K+ influx is enhanced following VUAA1 treatment at 1 mM KCl, a five-fold low extracellular concentration of K+ compared to panel (C). (E) Illustration of K+ imaging in olfactory sensory neurons, as achieved by expressing GINKO1 in cells driven by the Orco promoter-GAL4. (F) K+ efflux is observed upon VUAA1 stimulation in olfactory sensory neurons. (G) The plot of average time courses across various extracellular KCl concentrations. Green: K+ imaging in thecogen cells, driven by nompA-GAL4. Red: K+ imaging in Orco-positive OSNs driven by Orco-GAL4. Cyan line indicates time point at which concentration curves are drawn in the following panel. (H) Concentration curve for responses at 85 s-post VUAA1 treatment in thecogen cells. (I) Concentration curve for responses at 85 s-post VUAA1 treatment in OSNs, indicating an inverse relationship in K+ ion concentrations between the two cells. All error bars represent standard errors of the mean (SEM). Vertical blue lines indicate time points compared on each time course’s respective bar graphs. Paired student’s t-tests were used to compare time points. Asterisks indicate statistical significance (n.s.not significant, *p ≤ 0.05, **p ≤ 0.01).

