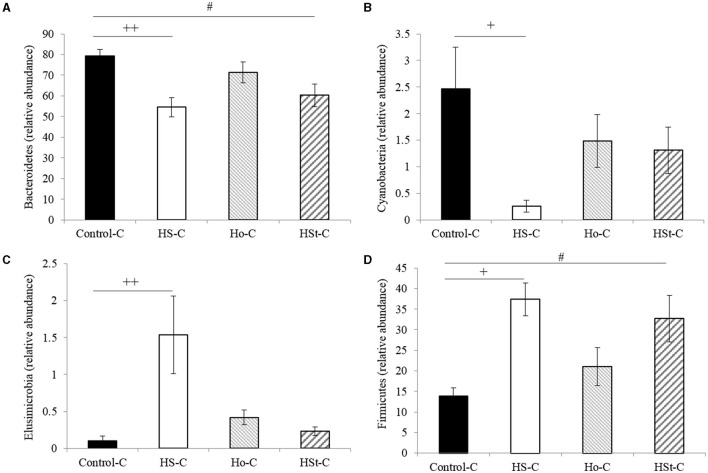
Figure 5.
Relative abundance of bacterial phyla of adult male rats. All the results are expressed as relative abundance (%) of sequences and presented as mean ± SEM. Statistical analyses were performed using one-way ANOVA and Dunnett's test post-hoc or Kruskall Wallis non-parametric equivalent test. Control-C (n = 5), HS-C (n = 5), Ho-C (n = 4), HSt-C (n = 5). + p < 0.05, ++ p < 0.01 (Control-C vs HS-C); # p < 0.05 (Control-C vs HSt-C).

