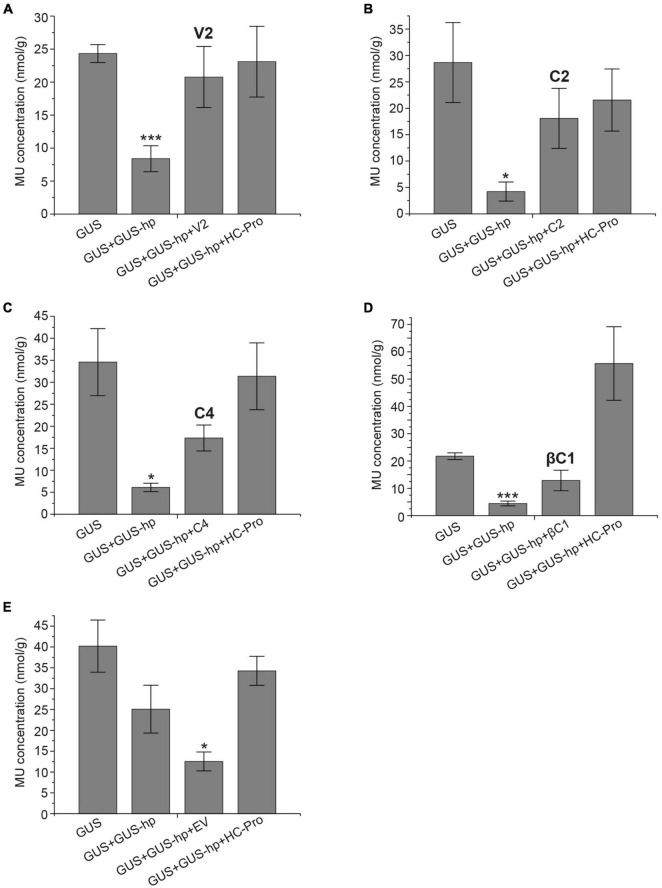
FIGURE 2.
GUS quantification (MUG) assays confirm the silencing suppressor function of CYVMV V2 (A), C2 (B), C4 (C), and βC1 (D). HC-Pro was used as a positive control. EV was used as a negative control (E). MU concentrations were presented as nmol per gram of leaf tissue (nmol/g). Each data point includes three biological replicates. Error bars denote standard error. Student’s t-test was used to determine the significance of differences. *P < 0.05 and ***P < 0.001.

