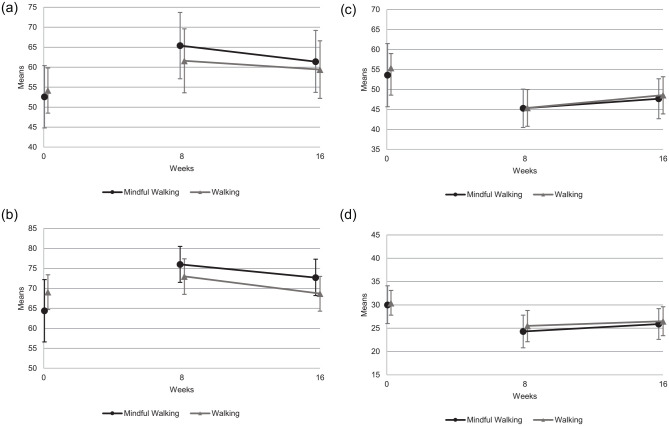
Figure 2.
Outcome parameters over 16 weeks. Baseline values are not adjusted means with 95% CI. Outcome parameters at 8 and 16 weeks are means adjusted for baseline value and stratification variables with 95% CI. (a) WHOQOL-BREF overall perception of life and health (0-100)† over 16 weeks. †Higher values indicate better quality of life. (b) FACT-G total score (0-108)† over 16 weeks. †Higher values indicate better quality of life. (c) PSQ (short form) overall score (0-100)+ over 16 weeks. +High overall score indicates high level of perceived stress. (d) CFS-D total score (0-60)‡ over 16 weeks. ‡Lower values indicate less suffering of fatigue.

