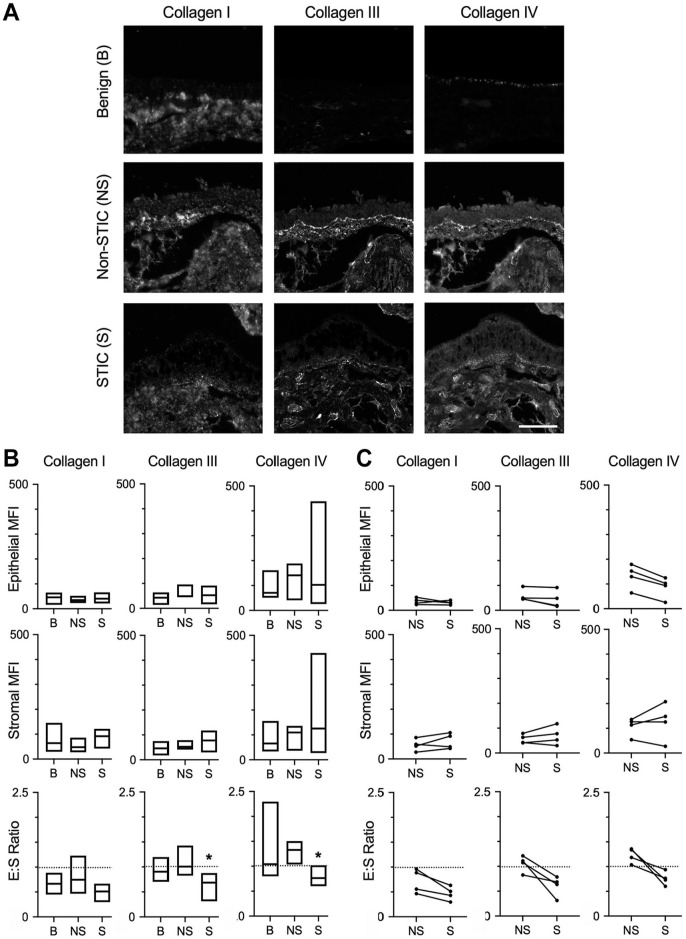
Figure 3.
Differential levels of collagens in STICs. (A) Representative multispectral staining of fimbriae for type I, type III, and type IV collagens in benign (B), non-STIC (NS), or STIC (S) regions. Scale bar = 200 µm. (B) Quantification of epithelial MFI, stromal MFI, and epithelial:stromal ratio (E:S ratio) of collagen I, collagen III, or collagen IV in benign (B), non-STIC (NS), or STIC (S) regions. Data are presented as a box plot indicating median and range; dashed line demonstrates E:S = 1. *p< 0.05 for S compared with B by Kruskal–Wallis test and Dunn’s multiple comparison posttest. n=10 (B), 8 (NS), and 7 (S). (C) Epithelial MFI, stromal MFI, and E:S ratio of patient-matched NS and S regions (indicated by connecting lines). Dashed line demonstrates E:S = 1. *p<0.05 by Wilcoxon matched-pair signed-rank test. n=4 patients. Abbreviations: STIC, serous intraepithelial carcinoma; MFI, mean fluorescent signal intensity.

