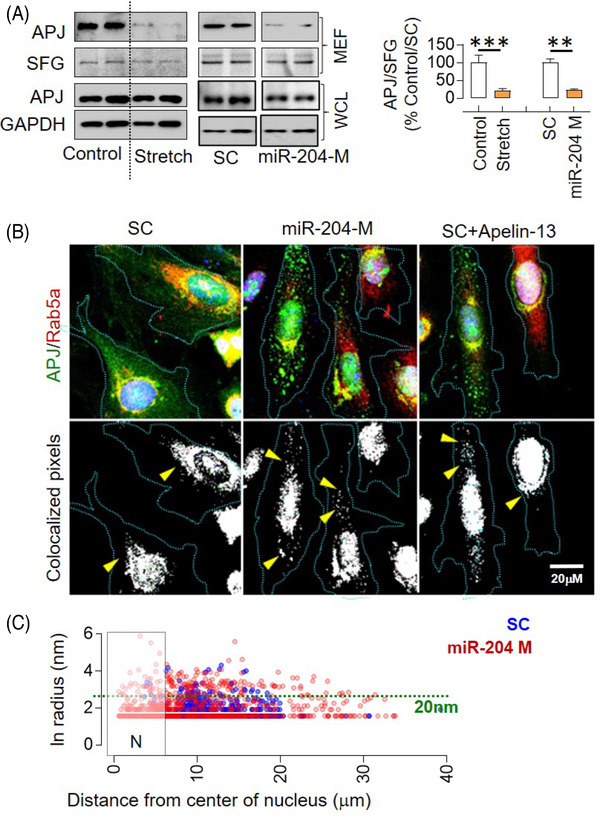
FIGURE 5.

miR‐204 induces APJ endocytosis. (A) Effect of stretch and miR‐204 overexpression on the APJ levels in membrane‐enriched fraction (MEF) and whole‐cell lysate (WCL) of H9C2 cells and its quantification (n = 4). The immunoblot for the miR‐204 experiment (right panel) originates from the same gel, and the uncropped image is provided in Figure S12. (B) Colocalisation of APJ with Rab5a (endosomal marker) in response to miR‐204 overexpression, as determined using the RG2B ImageJ plugin (arrowheads). H9C2 cells treated with apelin‐13 (1 h, 10 nM) served as a positive control; ×63 magnification. (C) The XY plot shows the radius of APJ and Rab5a‐positive puncta on the y‐axis (nm) and its distance from the nucleus on the x‐axis (μm). Quantification was done by ImageJ ‘analyse particles’ plugin. ‘N’ marks the nuclear boundary; the green dotted line marks a 20‐nm radius (n = 5). Data are shown as mean, and error bars represent SEM. **p < .01, ***p < .001, versus indicated group. SC, scrambled control; miR‐204 M, miR‐204 mimic; SFG, stain‐free gel
