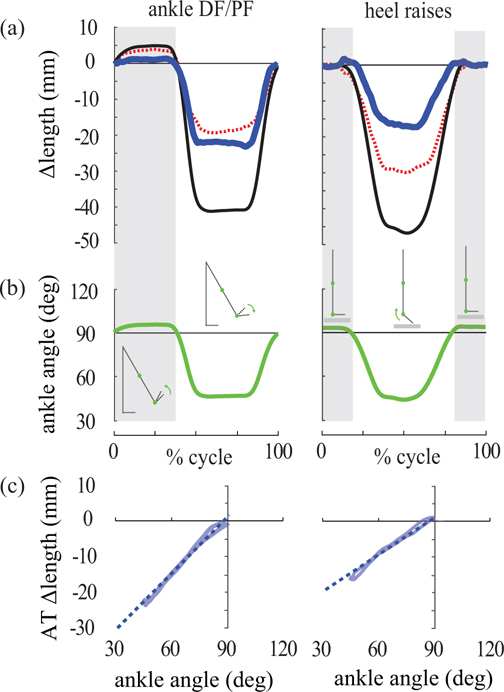
Fig. 4. AT length change and ankle angle data for a representative subject.
Results for the MTJ tracking method are shown for ankle DF/PF task (left column) and heel raises (right column). (a) AT (thick blue), muscle (dashed red) and MTU (thin black) length changes vs. movement cycle. (b) Ankle angle vs. movement cycle. 90° signifies neutral position, and decreasing angles indicate plantarflexion. (c) AT length change vs. ankle angle plotted only when the ankle was plantarflexed beyond neutral (<90°, white background of (b)). During these periods, the AT shortened proportionally (roughly linearly, dashed line) with decreasing ankle angle.

