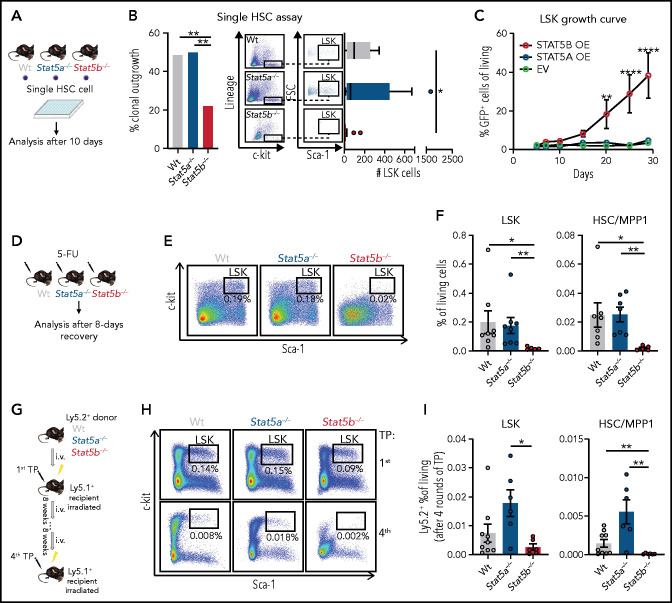
Figure 2.
STAT5B drives HSC self-renewal. (A-B) Single HSC assay using cell surface markers (lineage− [CD3, CD19, CD11b, Gr-1, Ter-119], c-kit+, Sca-1+, CD150+, CD48−). (A) Schematic of single cell in vitro cultures. Single HSC/MPP1 cells of WT, Stat5a−/−, or Stat5b−/− BM were FACS-sorted into individual wells and assessed for proliferation and surface marker expression after 10 days of culture. (Bi) Quantification of clonal outgrowth (n = 74/genotype). (Bii) Representative FACS plots of LSK gatings and quantification of total LSK cell numbers (n = 74/genotype, whiskers: Tukey). (C) STAT5A (STAT5A-green fluorescent protein [GFP]) or STAT5B (STAT5B-GFP) overexpression in LSK cells, EV (empty vector-GFP) was used as control. Competitive growth analyses over 28 days (n = 5/genotype, mean ± SEM). (D-F) 5-FU recovery assays of WT, Stat5a−/−, or Stat5b−/− mice. (D) Experimental workflow. (EF) Representative FACS plots of LSK gatings of lineage negative BM cells (E) and quantification of LSK cells and HSC/MPP1 cells 8 days after 5-FU injection (n ≥ 5/genotype, mean ± SEM). (G-I) Serial transplantation assays of WT, Stat5a−/−, or Stat5b−/− BM cells (F). (G) Experimental workflow: 5 × 10⁶ BM cells (Ly5.2+) were injected into lethally irradiated recipient mice (Ly5.1+) and reinjected 8 weeks after. TP (transplantation). (H) Representative LSK gatings of lineage negative BM cells 8 weeks after first and fourth transplantation. (I) Quantification of WT, Stat5a−/−, and Stat5b−/− LSK and HSC/MPP1 cells 8 weeks after fourth transplantation (n ≥ 6/genotype, mean ± SEM). Levels of significance were calculated using Fisher’s exact test (Bi) or 1-way ANOVA (Bii,F,I) or 2-way ANOVA (C). *P < .05; **P < .01; ****P < .0001.

