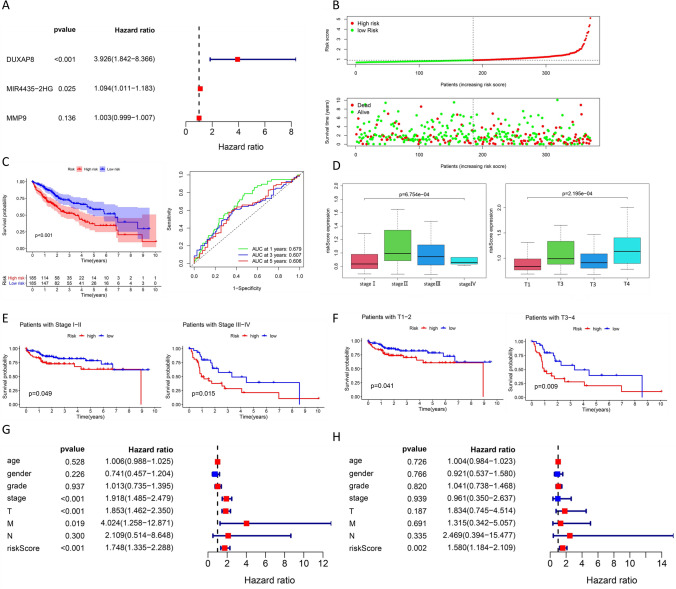
Fig. 5.
Construction of risk models for MIR4435-2HG and DUXAP8. a Multifactorial Cox regression analysis of MIR4435-2HG, MMP9, and DUXAP8. b Classification of HCC patients into two groups (high-risk and low-risk groups) according to the median risk scores. c Classification of liver cancer patients into high-risk and low-risk groups according to the median risk scores. d Correlation of TNM stage and depth of invasion (T) with risk scores. e Survival curves for the stage I–II (n = 163) and stage III–IV (n = 72) groups. f Survival curves for the T1–2 (n = 167) and T3–4 (n = 68) groups. g Univariate Cox and h multivariate Cox regression analysis

