
Figure 2. Effect of Urolithin A Supplementation on the 6-Minute Walk Distance and Maximal Adenosine Triphosphate (ATP) Production in Hand Muscles and Muscle Endurance .
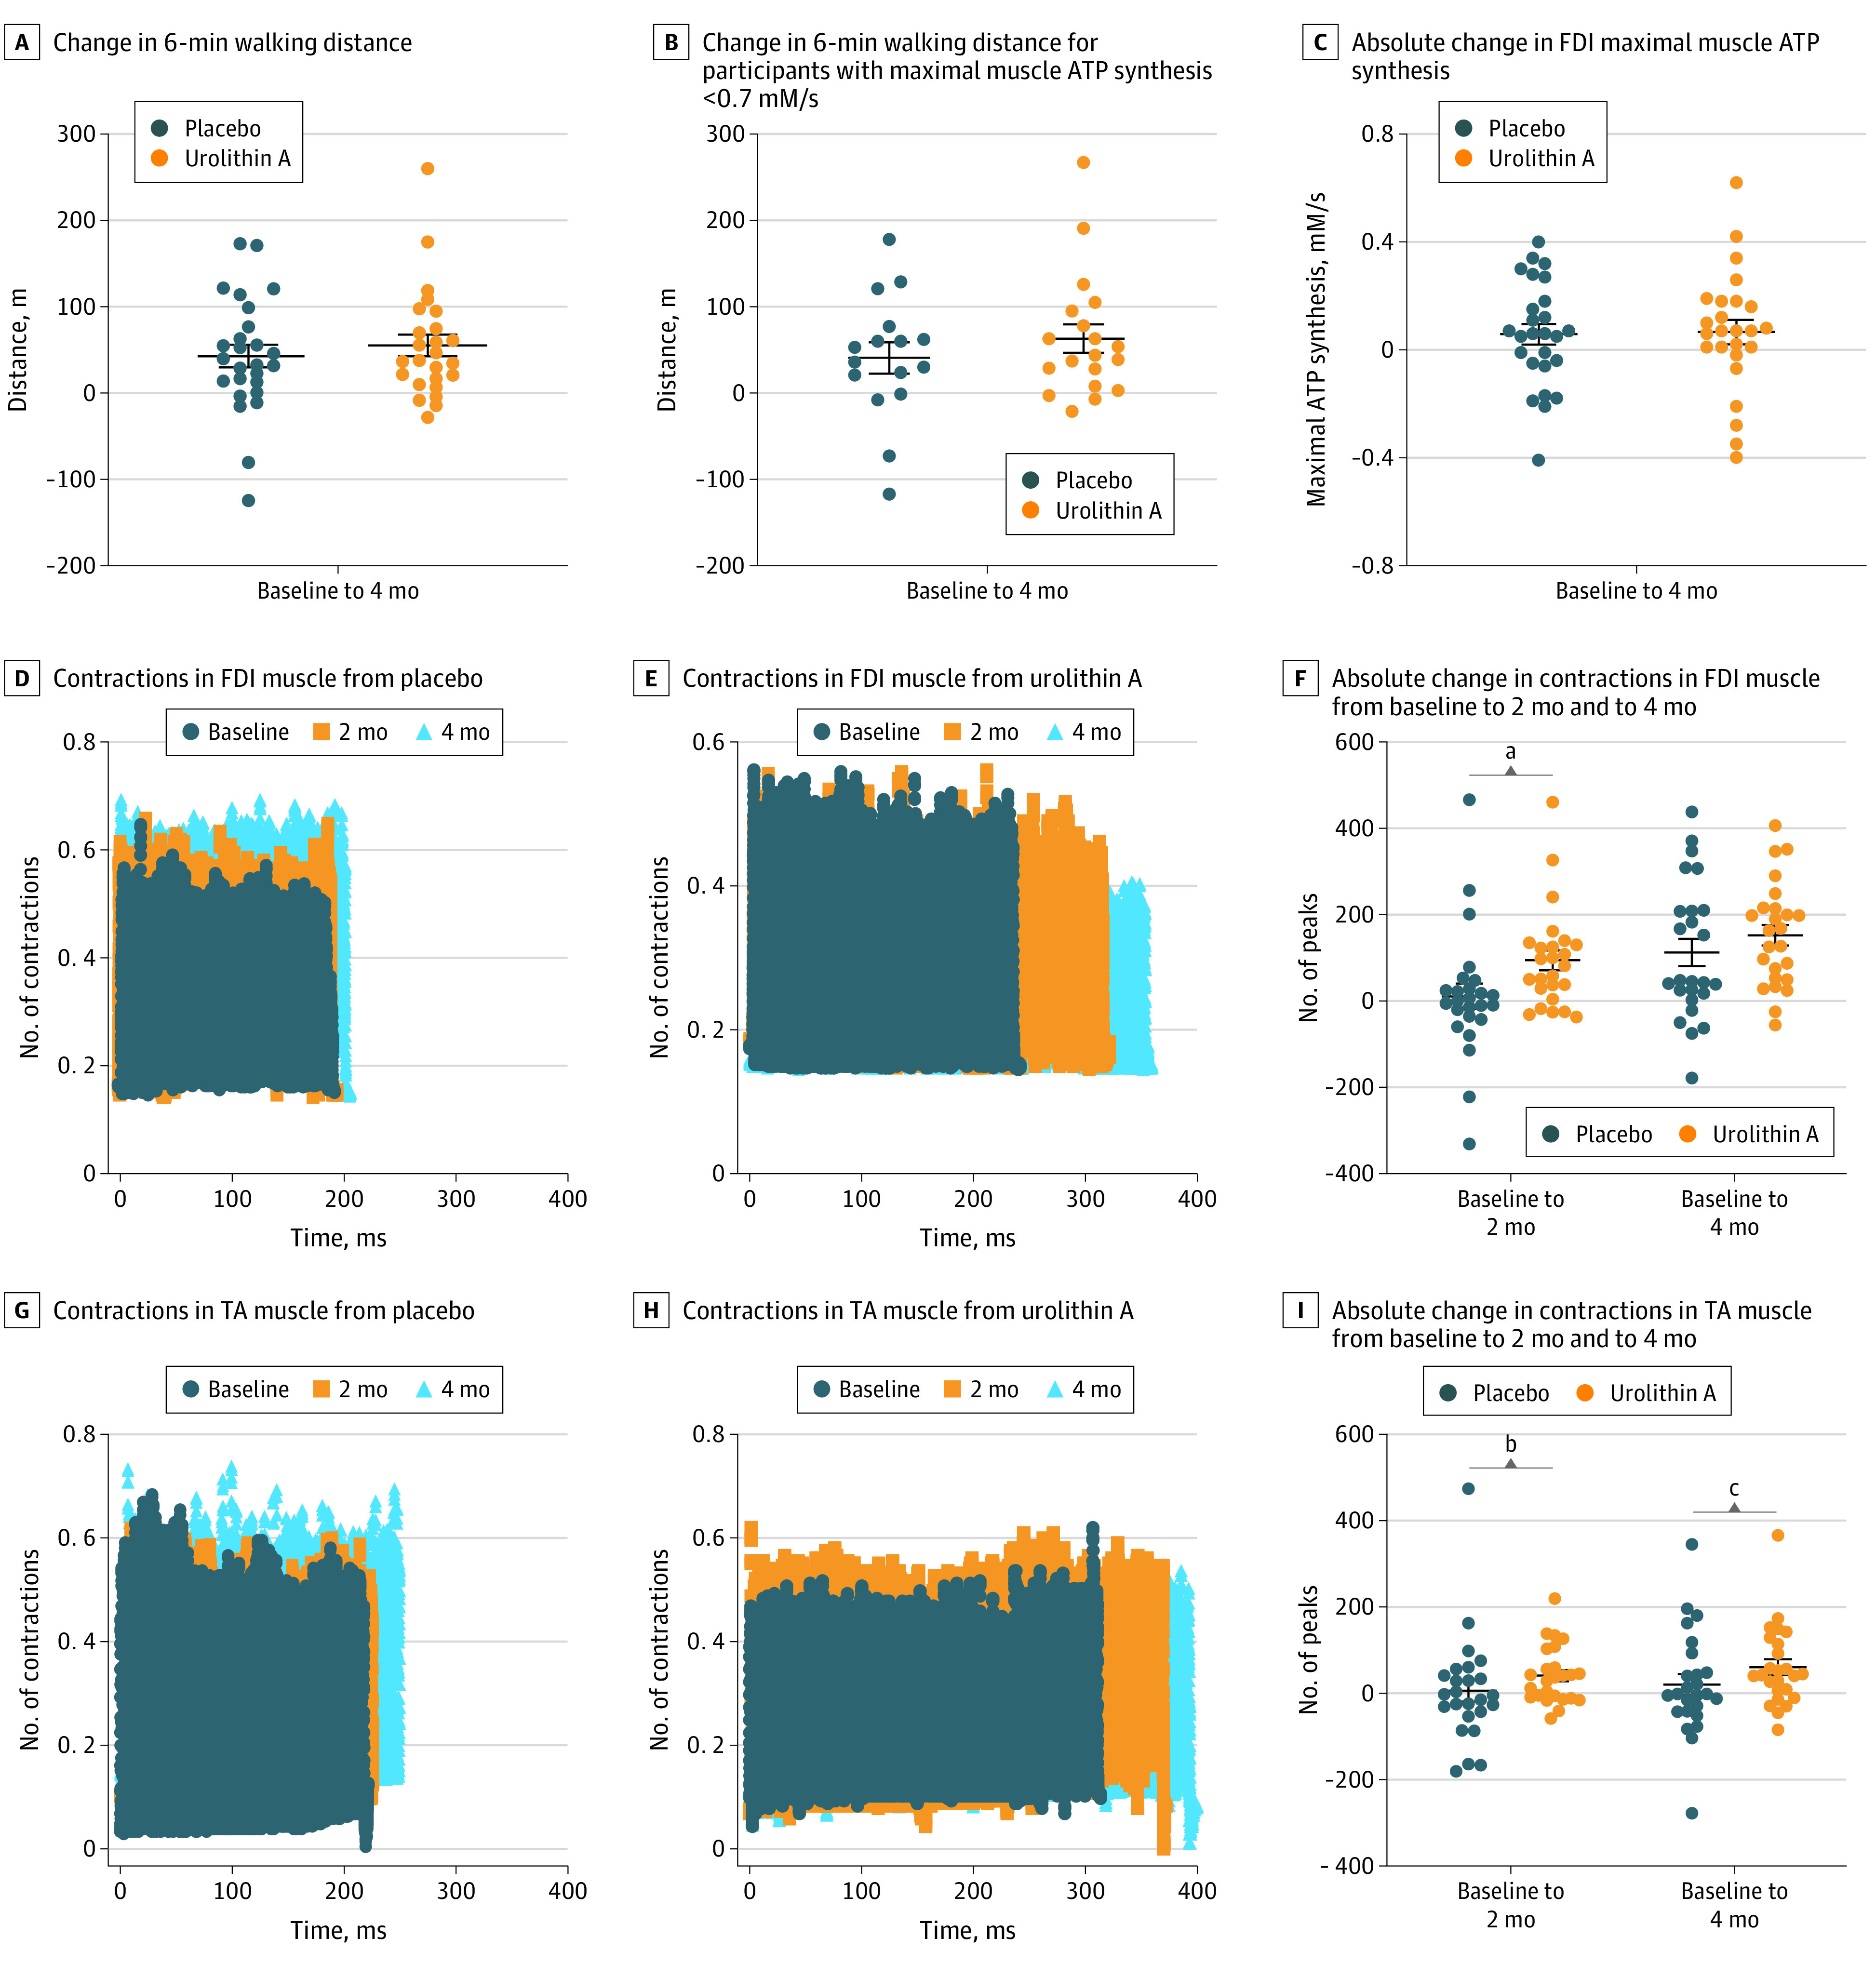
Data were analyzed using an analysis of covariance with 95% CIs for treatment differences. The center horizontal line represents the mean and the top and bottom lines represent the SEM. FDI indicates first dorsal interosseus; TA, tibialis anterior.
aP <.01 with post hoc 2-sided Wilcoxon 2-sample test.
bP = .05.
cP = .07 with post hoc 2-sided Wilcoxon 2-sample test.