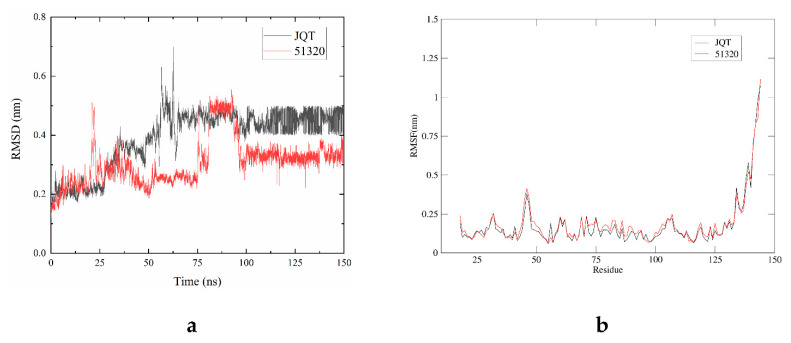
Figure 6.
Root mean square deviation (RMSD) and root mean square fluctuation (RMSF) plots of JQT complex (black), 51320 (red). (a) RMSD values extracted from protein fit ligand of the protein–ligand docked complexes. RMSD plot of JQT complex (black), 51320 (red); (b) the RMSF graph of all complexes along with protein during 100 ns MD simulation. RMSF plot of JQT complex (black), 51320 (red).

