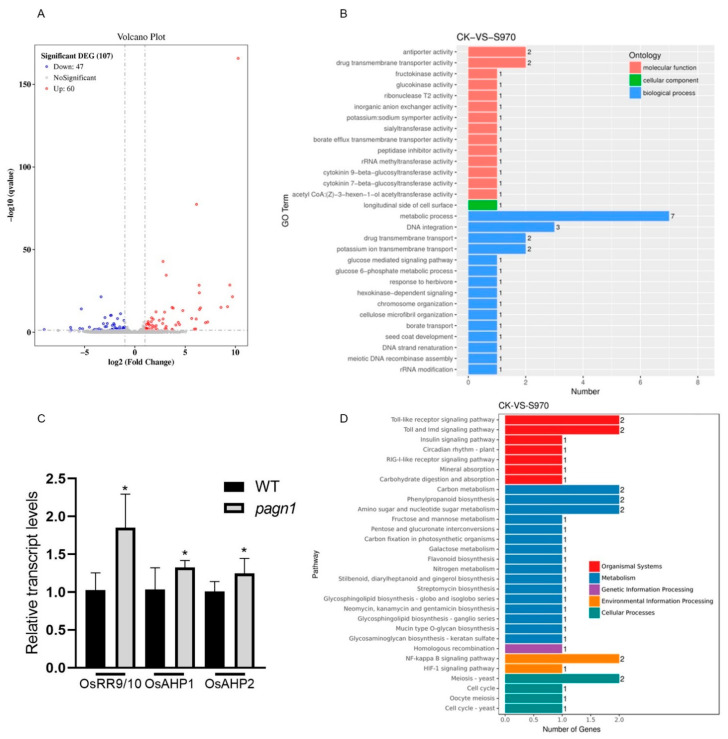
Figure 4.
Differentially expressed genes in the young panicles of OsPAGN1 knockout lines. (A) Volcano plot of genes regulated in both pagn1 plants. (B) GO analysis of DEGs. (C) Transcript levels of genes involved in the cytokinin signaling pathway. (D) KEGG pathway enrichment analysis of DEGs. The data are the mean ± SEM. * p < 0.05. (Student’s t test).

