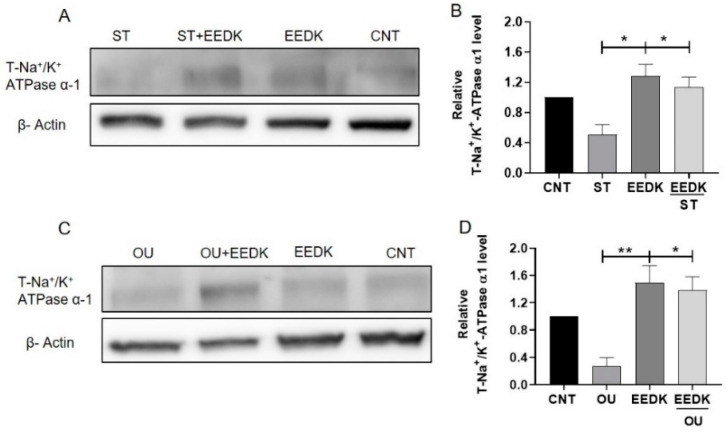
Figure 4.
Protein expression of total-Na+/K+-ATPase α1 subunit by western blot analysis. (A) Representative signals of expression. Top: Na+/K+-ATPase α1-subunit. Bottom: β-Actin, the relative intensity of each band to β-actin was measured by a densitometer as the expression of Na+/K+-ATPase α1-subunit. (B) Representative graph of 4A. Cells were exposed to ST 5 nM and ST with EEDK 2 µg/mL. Only EEDK and non-treated cells were used as controls after 24 h of treatment cells were assayed to analyze the expression level of Na+/K+-ATPase α1. (C) Representative signals of expression. Top: Na+/K+-ATPase α1-subunit. Bottom: β-Actin. (D) Representative graph of 4C. Cells were incubated with OU 50 nM with and without EEDK 2 µg/mL. Non-treated cells and only EEDK treated cells represent controls. Data are presented as the mean ± SEM of values from three experiments, * p < 0.05, ** p < 0.01 for the indicated comparisons (one-way ANOVA with Tukey’s multiple comparison test).

