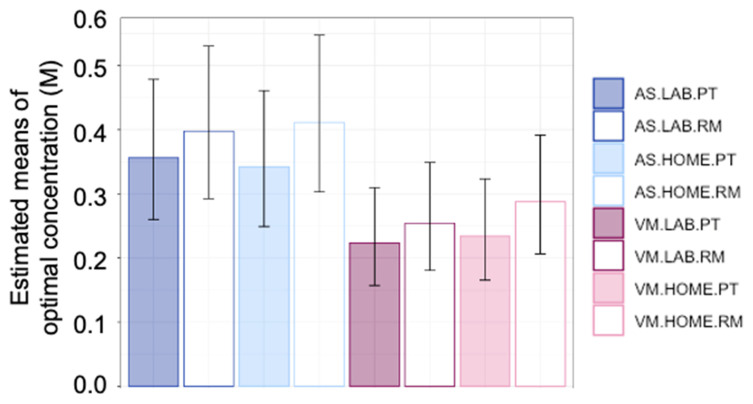
Figure 1.
Optimal sucrose concentrations, averaged across replicate test sessions. Values are means estimated from a repeated-measures ANOVA on Box-Cox transformed sucrose concentrations, then back-transformed to the original units (M). AS = estimated using aqueous solutions; VM = estimated using vanilla milk; lab = test conducted in the laboratory; home = test conducted with participants tasting at home, supervised via video conferencing; PT = Preference Tracking, or optimal (most preferred) concentration estimated via paired-comparison preference tracking; RM = Rating Method, or optimal (most liked) concentration estimated from ratings of liking. For example, AS.LAB.PT is optimal concentration estimated using aqueous solutions, in the laboratory, via paired-comparison preference tracking. Error bars represent 95% confidence intervals.

