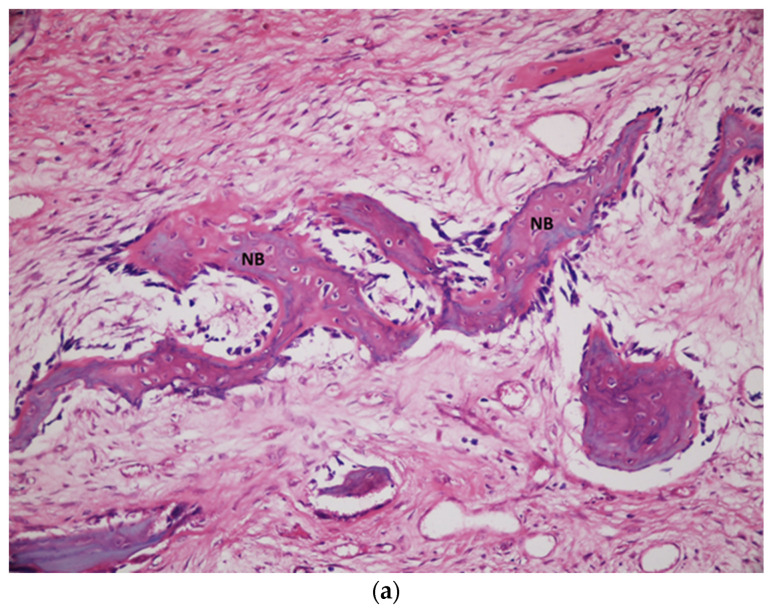
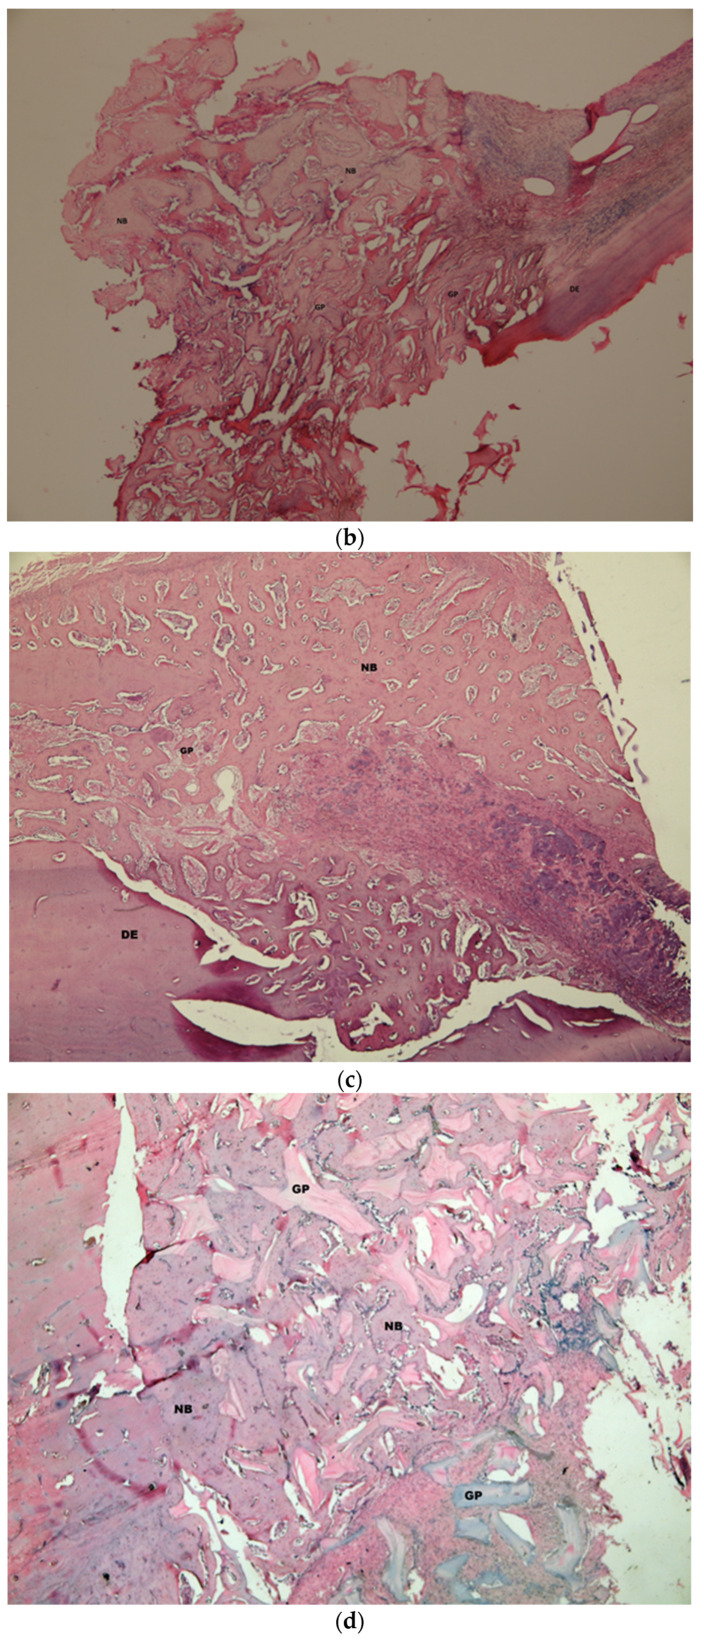
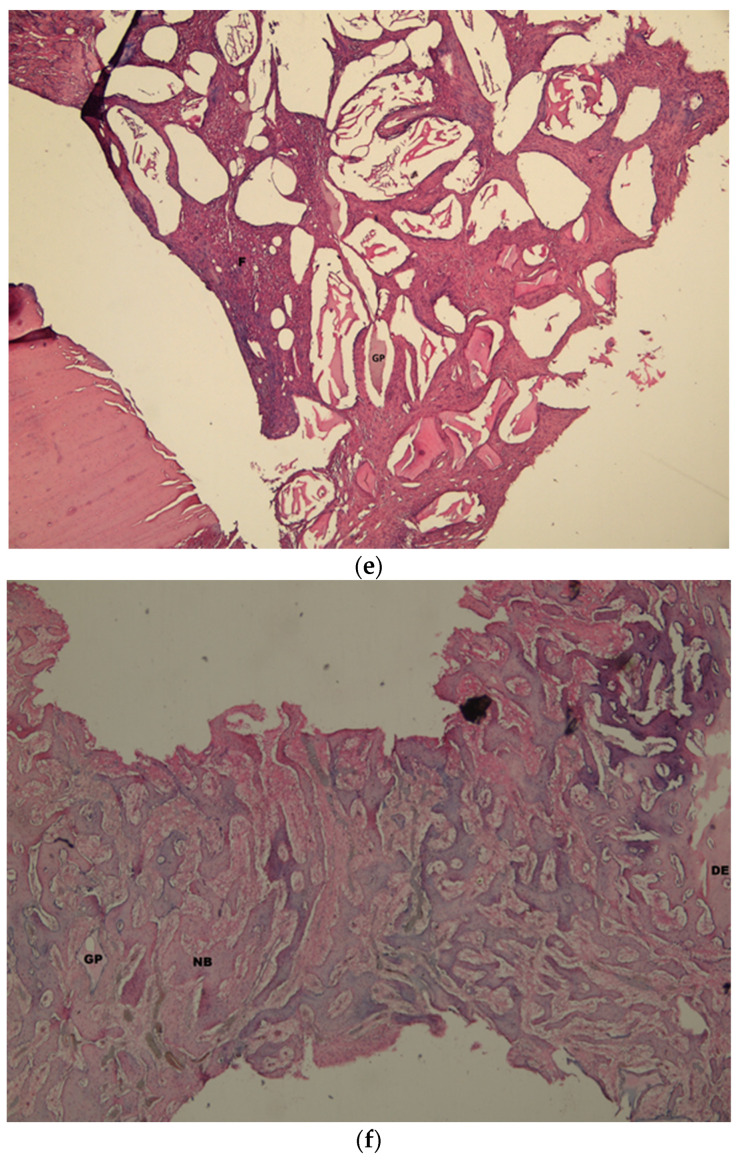
Figure 8.
(a). Histological view of the empty defect group (group E) on the 3rd week, New bone formation (NB) was observed in the active connective tissue. H&E ×100. (b). Histological view of the autogenous group (group A) on the 3rd week. New bone formation (NB) and graft particles (GP) were seen starting from defect edge (ED), H&E ×100. (c). Histological view of the dentin group (group D) on the 3rd week. New bone formation (NB) and graft particles (GP) were observed near the defect edge (DE) H&E ×100. (d). Histological view of the xenograft group (group X) on the 3rd week. Large new bone formation (NB) and graft particle were determined in the middle of the defect. H&E ×100. (e). Histological view of the autogenous + xenograft group (group A + X) on the 3rd week. Mixed fibrosis (F) and graft particles (GP) were seen just near the defect edge (DE) H&E ×100. (f). Histological view of the dentin + xenograft group (group D + X) on the 3rd week. New bone formation (NB) and graft particles (GP) were observed between the defect edges (DE) H&E ×100.


