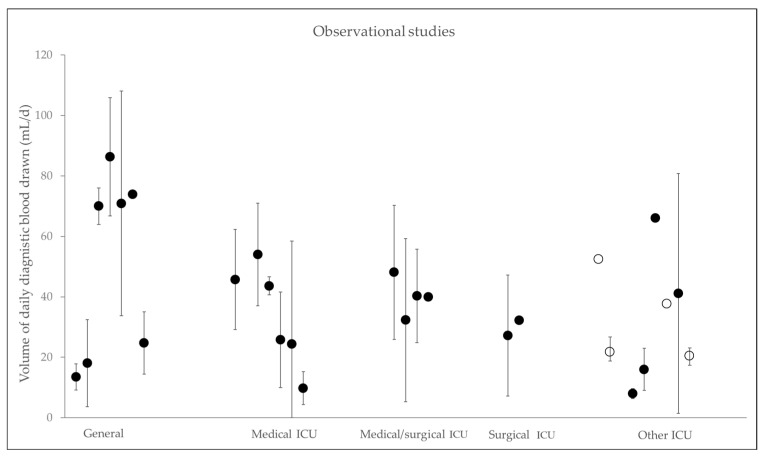
Figure 3.
Observational studies. Daily diagnostic blood drawn in mL/d, clustered into types of ICU. Black dots show mean with standard deviation and white spots show median with interquartile range. References corresponding to Table 3: General ICU [1,9,10,46,49,50,60]; Medical ICU [27,29,47,48,51,54]; Medical/surgical ICU [11,56,57,62]; Surgical ICU [33,64]; other ICU [32,52,53,55,59,61,63,65].

