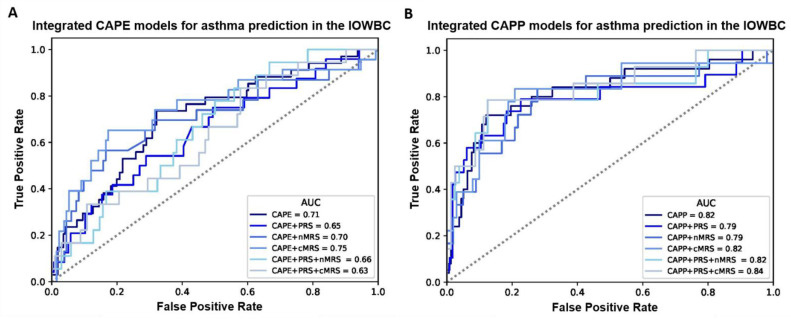
Figure 2.
ROC curves comparing the performance of all integrated CAPE and CAPP models in the IOWBC. (A,B) illustrate changes in the discriminative performance of the CAPE and CAPP models, respectively, upon the integration of the childhood asthma polygenic risk score (PRS) and/or newborn methylation risk score (nMRS) and childhood methylation risk score (cMRS) as additional features in the models.

