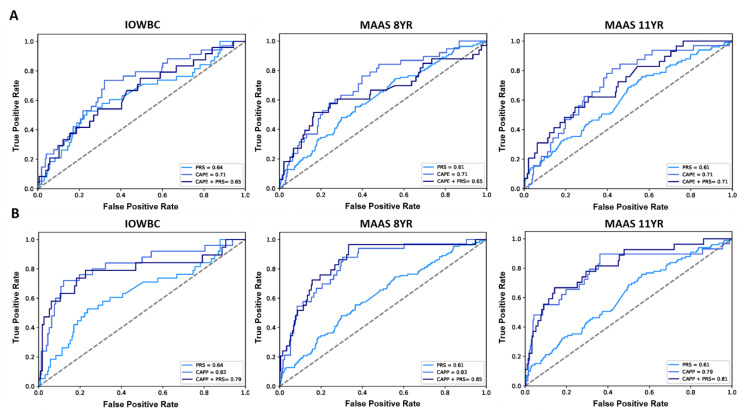
Figure 3.
ROC curves comparing the performance of the CAPE and CAPP models integrated with the PRS in the IOWBC and MAAS. (A) the discriminative performance of the childhood asthma polygenic risk score (PRS), CAPE model and integrated CAPE model (PRS added as an additional predictor in the model) to predict childhood asthma in the IOWBC at age 10 (left) and the Manchester Asthma and Allergy Study at ages 8 (middle) and 11 (right). (B) corresponding information for the CAPP model.

