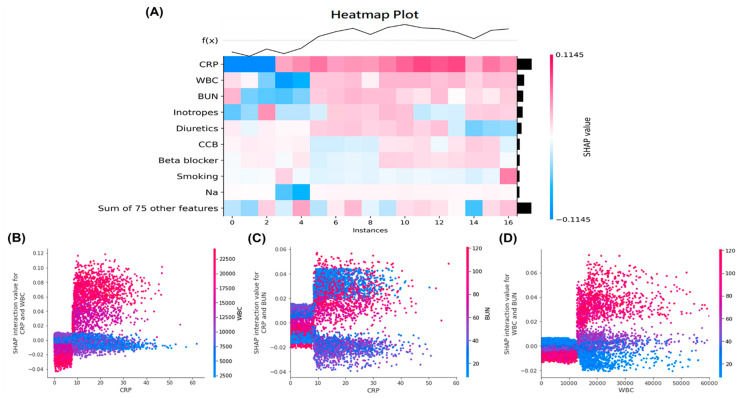
Figure 3.
(A) The SHAP heatmap plot with the model’s predictions for important features. The heatmap plot function creates a plot with the features on the y-axis, the model inputs on the x-axis, and the SHAP values encoded on a color scale with a higher value being redder, and a lower value being bluer. The SHAP dependence plots showed the interaction effects between (B) CRP and WBC, (C) CRP and BUN and (D) WBC and BUN in the LGBM model. Abbreviations: SHAP, SHapley Additive exPlanation; CRP, C-reactive protein; WBC, white blood cell counts; BUN, blood urea nitrogen; LGBM, light gradient boosting machine.

