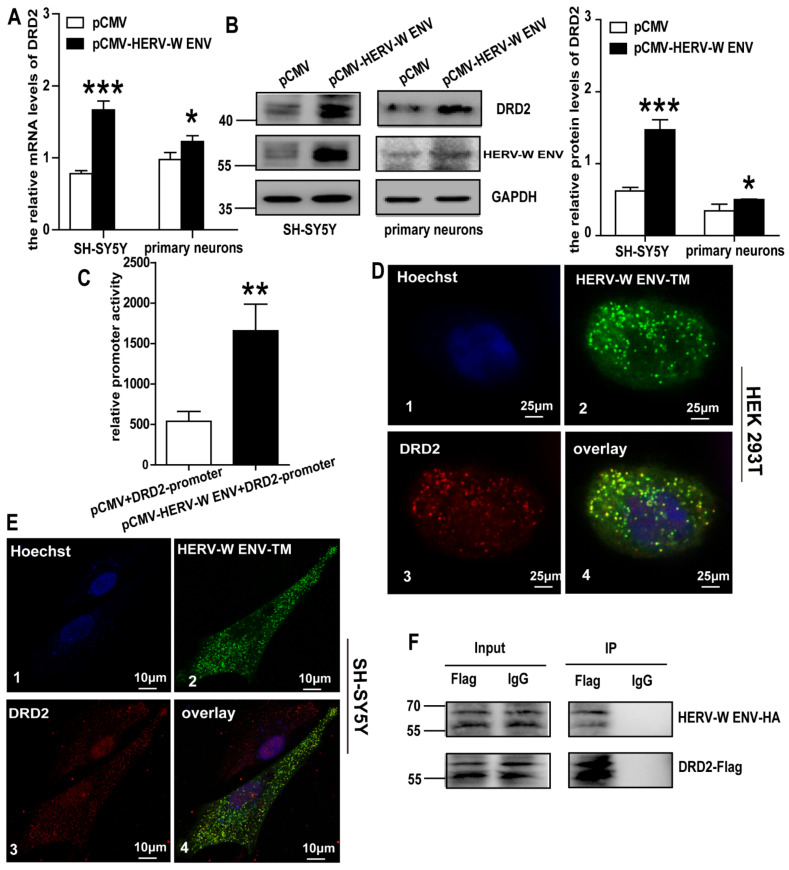
Figure 4.
HERV-W ENV increases DRD2 expression by colocalizing and interacting with it: (A) the mRNA level of DRD2 in the HERV-W ENV overexpression group was higher than the control group in the DA neurons. (B) The protein level of DRD2 in the HERV-W ENV overexpression group was higher than the control group in the DA neurons. (C) Luciferase assays of pGL3-DRD2 promoter co-transfected with pCMV-HERV-W ENV or control vector in SH-SY5Y cells. (D) Three-color STED images of Hoechst, which specifically stain the nuclei (D1), HERV-W ENV-TM (D2), and DRD2 (D3) in HEK293T cells (D4). Three-color overlay STED images of Hoechst, pEGFP-HERV-W ENV-TM, and pENTER-DRD2 in HEK293T cells. (E) Three-color STED images performed as in Figure 4D in SH-SY5Y cells. (F) Co-IP results shown in the DRD2-Flag-IP group could show the HERV-W ENV-HA band but could not show such in the negative control, which demonstrated the interactions between each other. * p < 0.05, ** p < 0.01, *** p < 0.001.

