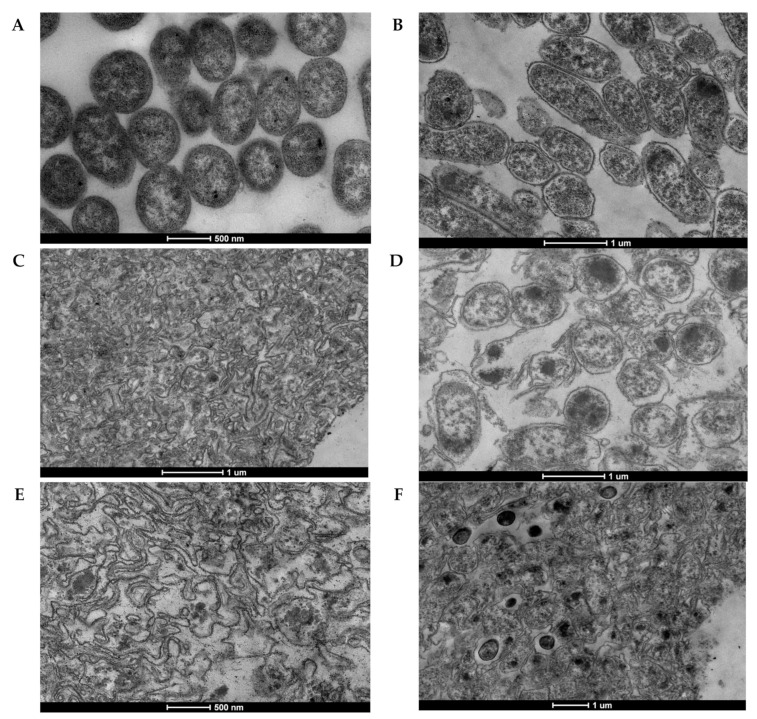
Figure 3.
Transmission electron micrographs of Y. pestis strains (A) KM260(12)∆lpxM, (B) KM260(12)∆lpxM) pEYR’-E, (C) KM260(12)∆lpxM/pEYR’-Y-K, (D) KM260(12)∆lpxM/pEYR’-S-R-Rz KM260(12)∆lpxM/pEYR’-S-R-Rz, (E) KM260(12)∆lpxM/pEYR’E-Y-K, (F) KM260(12)∆lpxM pEYR’-E-S-R-Rz. (24 h after the induction).The bar represents 0.1 μm (B–D,F) or 500 nm (A,E).

