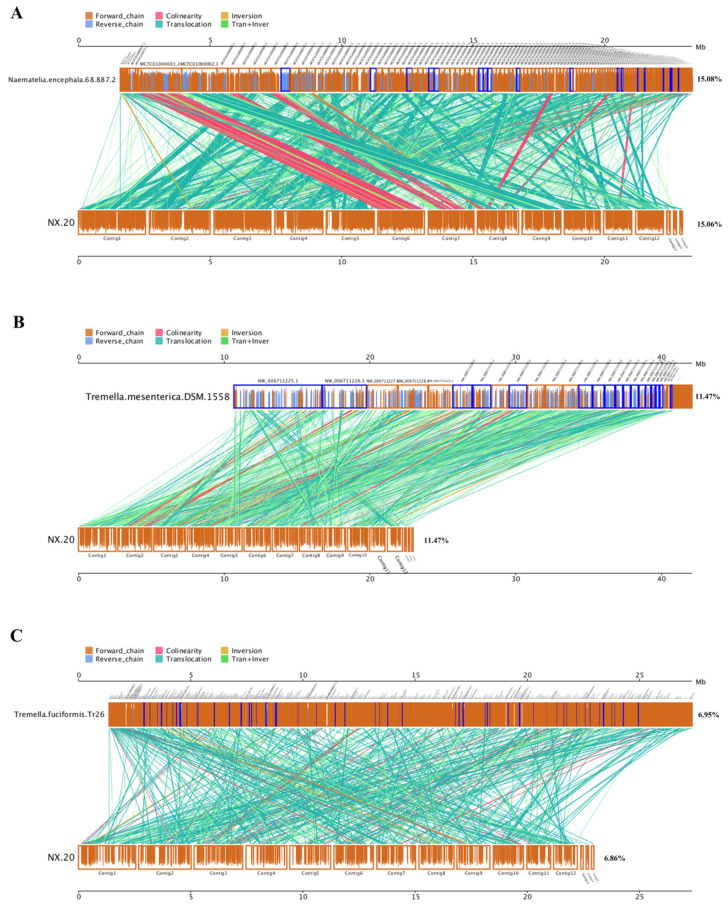
Figure 4.
Synteny of N. aurantialba NX-20 with N. encephala 68-887.2 (A), T. mesenterica DSM 1558 (B), and Tremella fuciformis Tr26 (C). The upper axis indicates the genome measured, and the lower axis indicates the reference sequence genome. The forward and reverse strands are represented by yellow boxes and blue boxes, respectively. The height of the filled color in the box indicates the similarity of the alignment, and full filling indicates 100% similarity. The color of the linked graph between the upper and lower axes indicates the alignment type: Collinear, syntenic alignment; Translocation, translocation alignment; Inversion, inverted alignment; Tran + inver, alignment of translocations and inversions.

