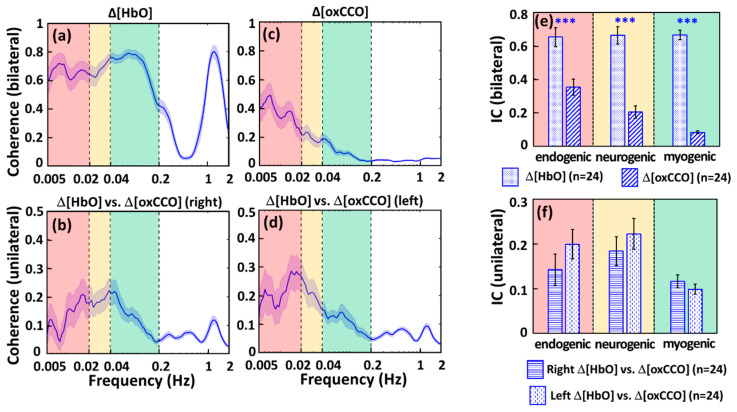
Figure 2.
WTC-derived, resting-state coherence spectra at the group level (n = 24) are shown between (a) bilateral prefrontal Δ[HbO], (b) unilateral Δ[HbO] and Δ[oxCCO] on the right prefrontal side, (c) bilateral prefrontal Δ[oxCCO], and (d) unilateral Δ[HbO] and Δ[oxCCO] on the left prefrontal side. The blue-shaded band along with each spectrum marks the respective standard error of the mean. The red-, yellow-, and green-shaded boxes denote the endogenic, neurogenic, and myogenic frequency bands, respectively. Furthermore, spectrally averaged Indexes of Coherence (IC) are plotted at each ISO frequency band for (e) bilateral Δ[HbO] and bilateral Δ[oxCCO] and (f) unilateral interplay/coherence between Δ[HbO] and Δ[oxCCO] for each side of the prefrontal cortex at rest. Error bars indicate the standard error of the mean (n = 24). “***” indicates significant differences at p < 0.0001 based on paired t-tests.

