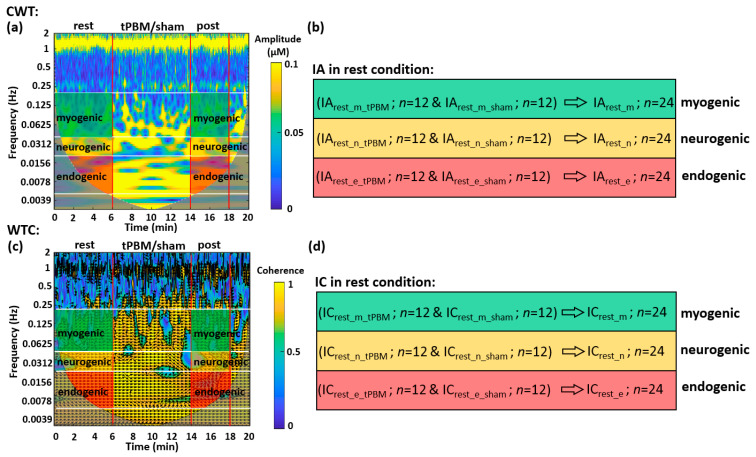
Figure 6.
Example of CWT and WTC spectrograms presented in time-frequency maps and parameterized indexes for the data taken at rest. (a) It plots a CWT spectrogram generated from the right forehead of one subject. The vertical red lines segment the experimental time into three periods: a 6-min resting period, an 8-min tPBM period, and a 4-min post-tPBM/sham period. The white horizontal lines mark three frequency bands: endogenic (0.005–0.02 Hz; red-shaded), neurogenic (0.02–0.04 Hz; yellow-shaded), and myogenic (0.04–0.2 Hz; green-shaded) bands. The colormap indicates the time-frequency dependent amplitude of wavelet transform of the Δ[HbO] time series. Two gray-shaded areas indicate the cone of influence (COI) caused by the edge effects of wavelets and excluded for further data processing due to unreliability [84,85,86]. (b) It expresses the index of amplitude (IA) calculated by averaging CWT amplitude in the 2-dimensional, shaded areas given in (a) for respective ISO frequency bands. Subscripts of “rest_m_tPBM” and “rest_m_sham” mean under resting and sham conditions for tPBM experiment at myogenic frequency, respectively. The same notations apply to the other two situations. “n = 12” indicates the subject number for each of tPBM and sham experiments. For both baseline measurements, the total measurement number becomes 24. (c) It plots a WTC spectrogram generated from the coherence between two bilateral Δ[HbO] time series of one subject. Both red vertical and white horizontal lines serve the same purposes as those in (a). The arrows indicate the phase relationships between the two time series. The colormap marks time-frequency-dependent coherence amplitude between two bilateral Δ[HbO] time series. The gray-shaded COI areas were excluded for further data analysis. (d) It expresses the index of coherence (IC) for each ISO frequency band calculated by averaging shaded areas given in (c) for respective ISO frequency bands. While the red-, yellow-, and green-shaded areas in (a) and (c) are the regions of interest for calculations of IA and IC in three respective ISO frequency bands, they were separately quantified for the resting (or pre tPBM) and post-tPBM period.

