Figure 1.
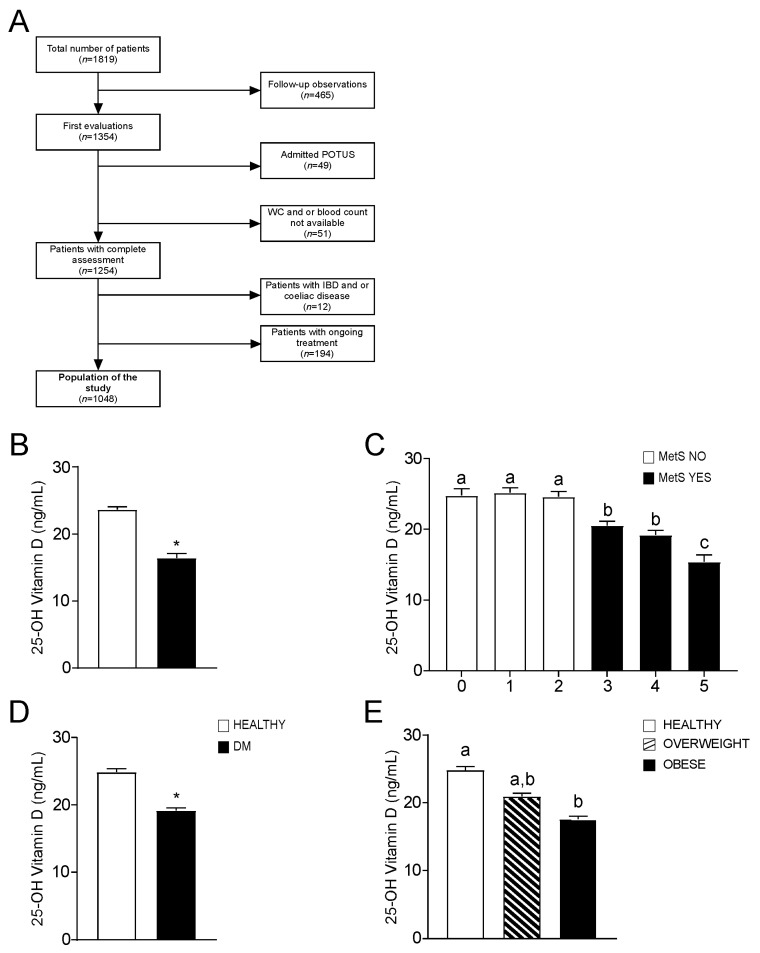
Flowchart of study population and 25-OH vitamin D levels in different subgroups. (A) Flowchart of the study population. (B) Comparison of 25-OH vitamin D levels in the entire study population. Subjects categorized based on Metabolic Syndrome (MetS) diagnosis; non-metabolic (MetS NO) subjects n = 466, MetS (MetS YES) patients n = 582. (C) Comparison of 25-OH vitamin D levels. Subjects were categorized based on positivity for MetS criteria. 0 criteria n = 139, 1 criterion n = 157, 2 criteria n = 170, 3 criteria n = 225, 4 criteria n = 216, 5 criteria n = 141. (D) Comparison of 25-OH vitamin D levels according to the type-2 Diabetes Mellitus (DM) definition (E) Comparison of 25-OH vitamin D values according to BMI definition. Subjects were divided in three different categories. Healthy n = 384, Overweight n = 341, Obese n = 323. All data are presented as mean ± SEM. Student T-test was performed for comparison of two groups, with * p < 0.05. One-way ANOVA test followed by Bonferroni’s post-hoc test was used for comparison of three or more groups. Data from groups sharing the same lowercase letter were not significantly different, whereas data from groups with different case letter were significantly different (p < 0.05).

