Figure 4.
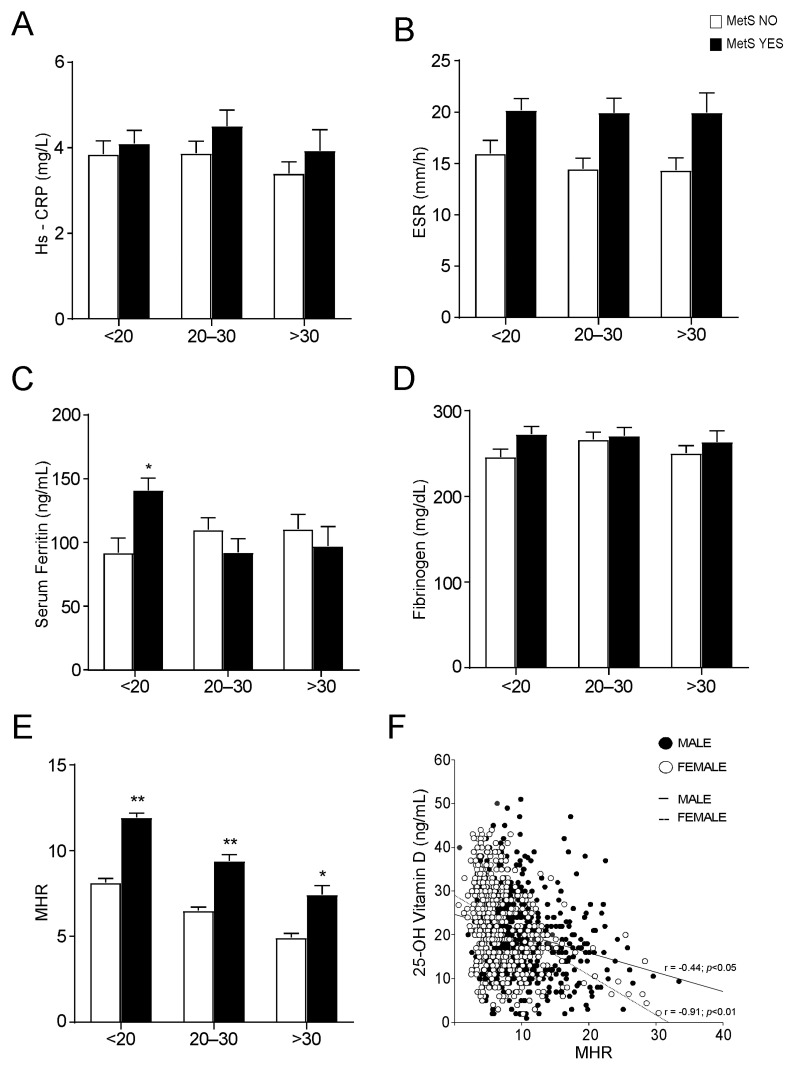
Evaluation of serum inflammation markers and Monocyte-to-HDL ratio in non-metabolic and metabolic subjects, divided by 25-OH vitamin D levels. (A–D) Comparison of serum inflammation markers in non-metabolic (MetS NO) and MetS (MetS YES) subjects, divided by 25-OH vitamin D levels. Data is presented as mean ± SEM. Statistical significance was assessed by Student T-test (* p < 0.05). (E) Comparison of Monocyte-to-HDL ratio (MHR) levels in non-metabolic (MetS NO) and MetS (MetS YES) subjects, divided by 25-OH vitamin D levels. Data is presented as mean ± SEM. Statistical significance was assessed by Student t-test (* p < 0.05, ** p < 0.01). (F) Correlation analysis of 25-OH vitamin D and MHR in the entire study population, divided by gender.

