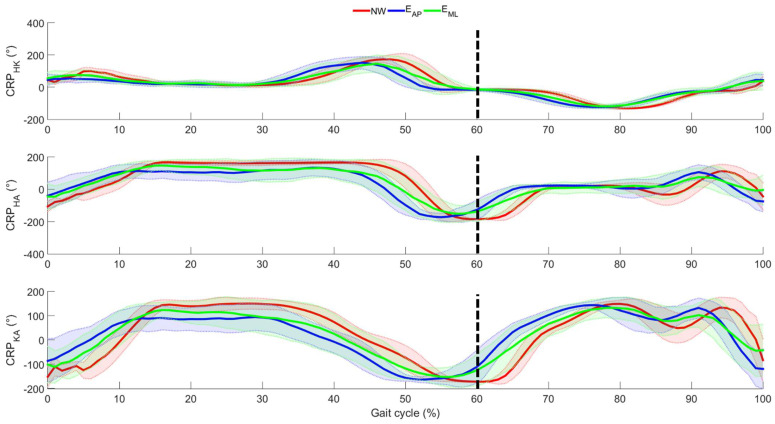
Figure 6.
Mean (bold line) and standard deviation (shaded area) of the lower limb joint CRP as averaged across participants. Red, blue, and green are used to identify the normal walking, the perturbed locomotion in anterior-posterior direction, and the perturbed locomotion in medio-lateral direction, respectively. Dotted, black line represents the transition between stance and swing phases in NW.

