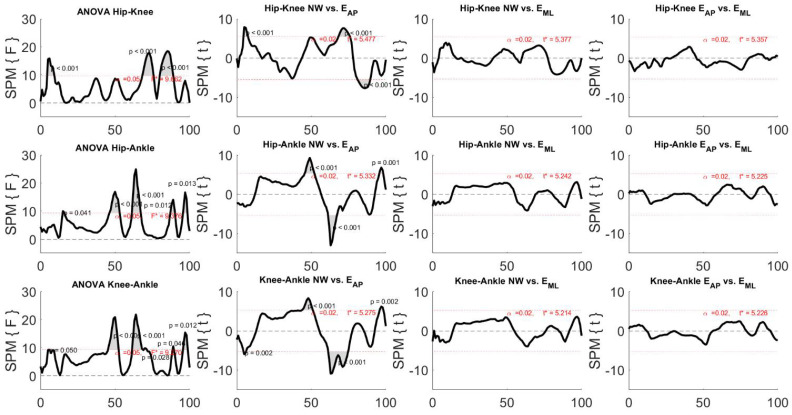
Figure 7.
Results of the one-way repeated measurement ANOVA SPM and related post-hoc analysis for CRP curves. Black, bold lines indicate the statistical maps, the dotted, red lines indicate the critical threshold, and the grey areas indicate the significant difference among independent variables, i.e., the three motion tasks. F* and t* indicate the F-value and t-value for ANOVA and t-tests, respectively.

