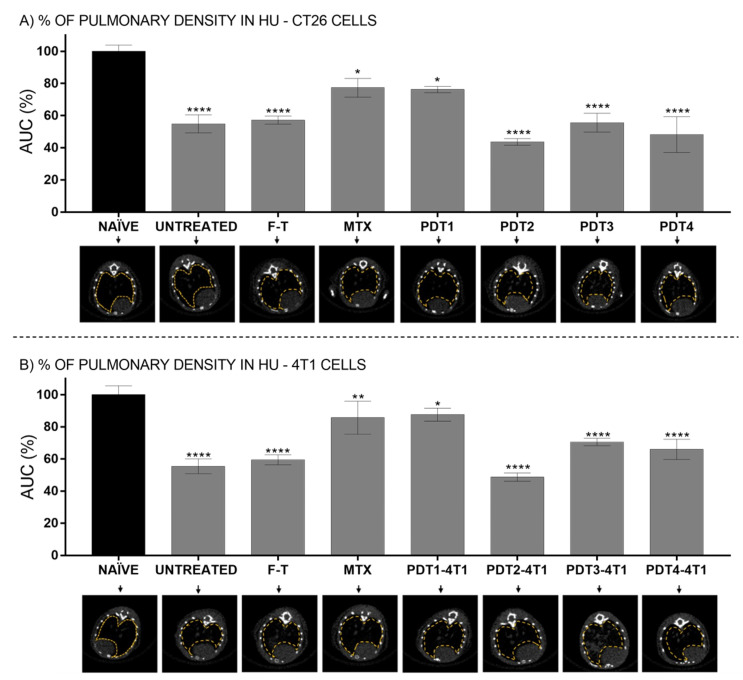
Figure 4.
In vivo CT quantification of lung density area using HU values. (A) Lung density of animals subjected to vaccination with CT26 cells pretreated with PBS (untreated); F-T; MTX and different PDT protocols. (B) Lung density of animals subjected to vaccination with 4T1 cells pretreated with PBS (untreated); F-T; MTX and different PDT protocols. Group of healthy animals (naïve) were used as the control for evaluation of lung density (100%-black bars). Lung 2D representative CT-transverse of the animals references the groups: CT26 cells—PDT protocols: PDT1 = 12.2 nM and 25 J/cm2; PDT2 = 31.5 nM and 25 J/cm2; PDT3 = 12.2 nM and 67 J/cm2; and PDT4 = 31.5 nM and 67 J/cm2. 4T1 cells—PDT protocols: PDT1 = 9.01 nM and 25 J/cm2; PDT2 = 19.4 nM and 25 J/cm2; PDT3 = 9.01 nM and 67 J/cm2; and PDT4 = 19.4 nM and 67 J/cm2. MTX (mitoxantrone); F-T (three cycles of freeze-thawing); PBS: phosphate buffered saline. Superscript *, ** and **** means p < 0.05, p < 0.01 and p < 0.001, respectively. For all data, n = 6 mice, mean ± SEM.

