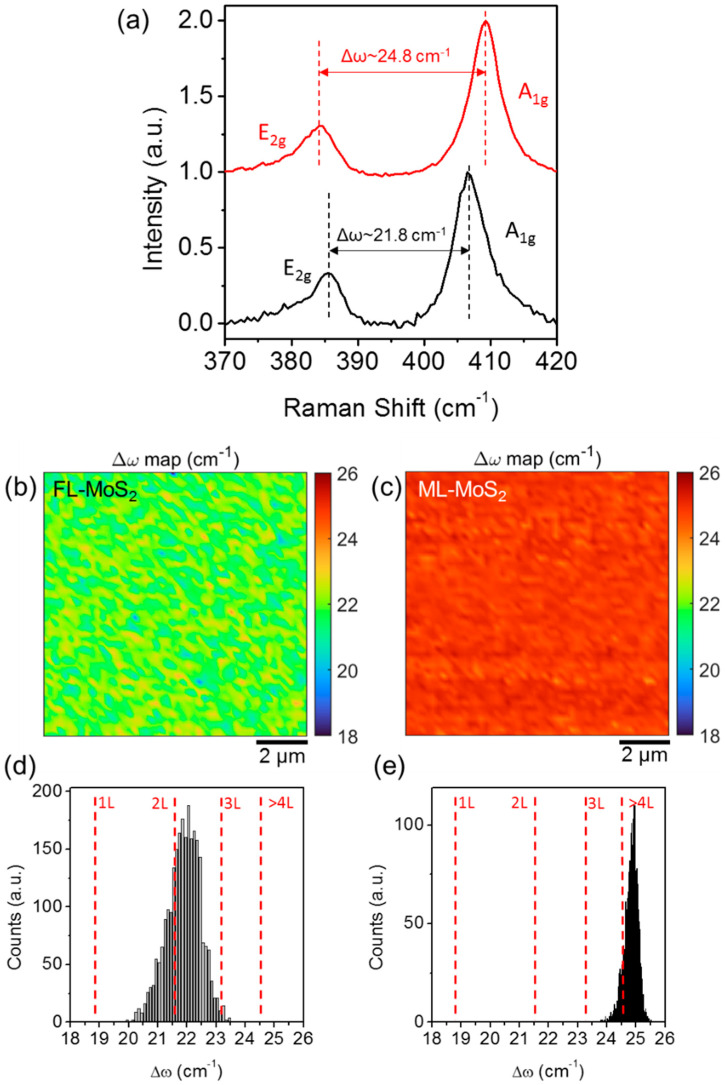
Figure 5.
(a) Representative Raman spectra of the few-layers (FL) MoS2 (black-line) and multilayer (ML) MoS2 samples obtained by sulfurization of the 2.8 and 4.2 nm MoO3 films on SiO2. Colour maps of the A1g-E2g wavenumber difference Δω obtained from arrays of Raman spectra collected on 10 μm × 10 μm scan areas on the FL-MoS2 (b) and on the ML-MoS2 (c) samples. Histogram of Δω values showing a distribution with a peak at ω ≈ 21.8 ± 0.6 cm−1 for the FL-MoS2 sample associated to 2 L–3 L MoS2 (d) and ω ≈ 24.8 ± 0.4 cm−1 for the ML-MoS2 sample, corresponding to >4 L MoS2 thickness (e).

