Figure 6.
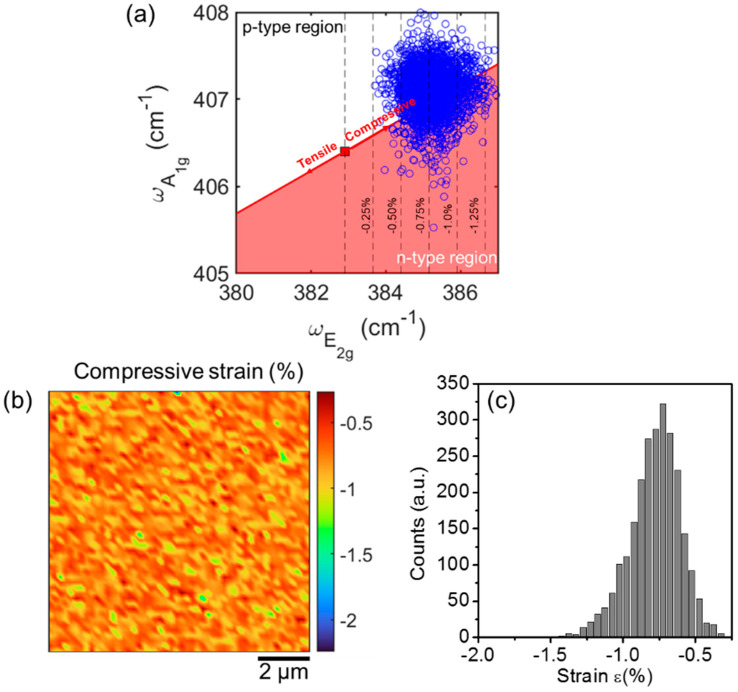
(a) Correlative plot of the ωA1g and ωE2g values (blue circles) extracted from all the Raman spectra in the array of Figure 5. The red line represents the ideal ωA1g vs. ωE2g dependence (i.e., the strain line) for a purely strained 3L-MoS2 film. The red square corresponds to the frequencies and for an ideally unstrained and undoped 3L-MoS2, while the two red arrows with opposite directions along the strain line indicate the tensile (red-shift) and compressive strain (blue-shift), respectively. (b) Map and (c) corresponding histogram of the compressive strain on a 10 μm × 10 μm area.

