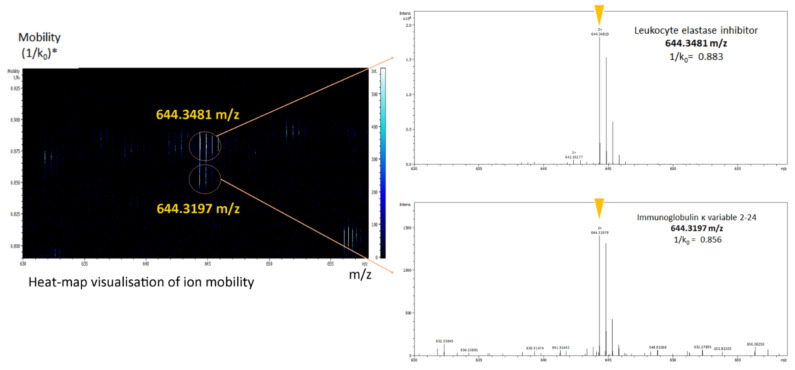
Figure 5.
Heat-map visualization of ion mobility. The peptide ions of two different proteins with almost the same mass-to-charge ratio (m/z) at a single time point were differentiated by the timsTOF Pro analysis. The circled lines indicate the m/z and mobility positions of two precursor ions selected for fragmentation by parallel accumulation-serial fragmentation (PASEF). *; (1/k0), the drift time.

