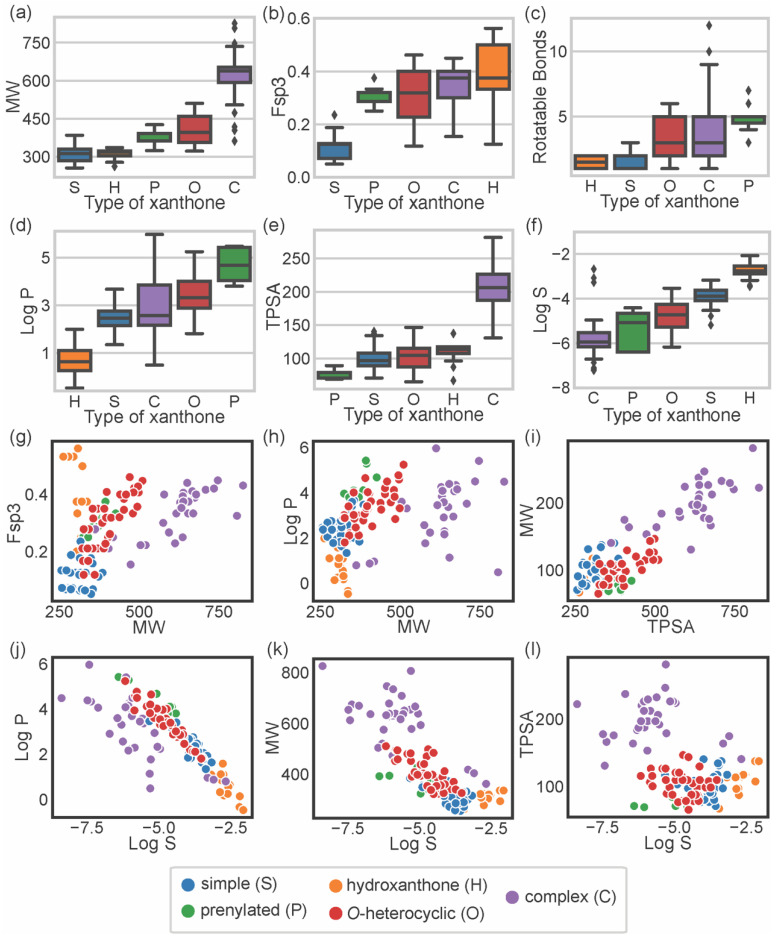
Figure 3.
Distribution of MW (a); Fsp3 (b); number of RBs (c); log P (d); TPSA (e); and log S (f) accordingly to the type of xanthone: “simple” (S, blue), “prenylated” (P, green), “hydroxanthone” (H, orange), O-heterocyclic (O, red), and complex (C, purple). Comparison between the values of Fsp3 carbons and MW (g); log P and MW (h); MW and TPSA (i); log P and log S (j); MW and log S (k); TPSA and log S (l).

