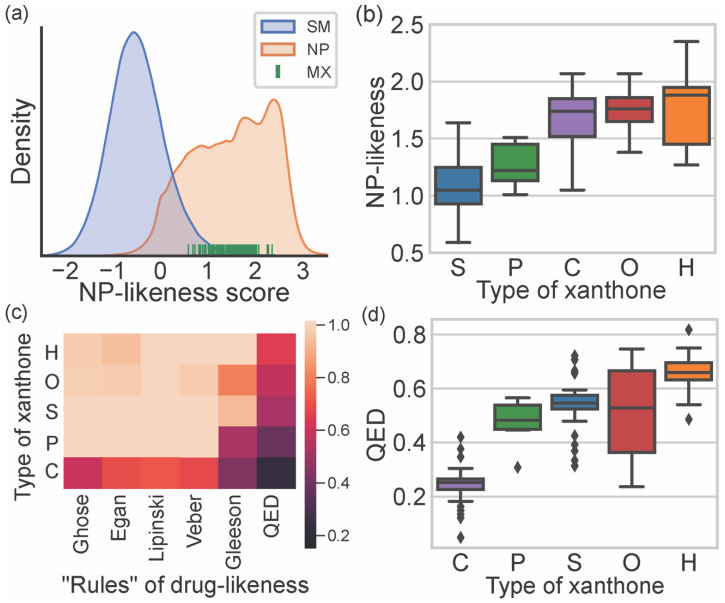
Figure 4.
(a) KDE distribution plot NP-likeness score of synthetic molecules (SM), natural products (NP), and NP-likeness score of marine xanthones. (b) Distribution of NP-likeness score accordingly to the type of xanthone: “simple” (S, blue), “prenylated” (P, green), “hydroxanthone” (H, orange), “O-heterocyclic” (O, red), and “complex” (C, purple). (c) Heatmap of the compliance with rules of drug-likeness for the xanthone types. (d) Distribution of QED index accordingly to the type of xanthone.

