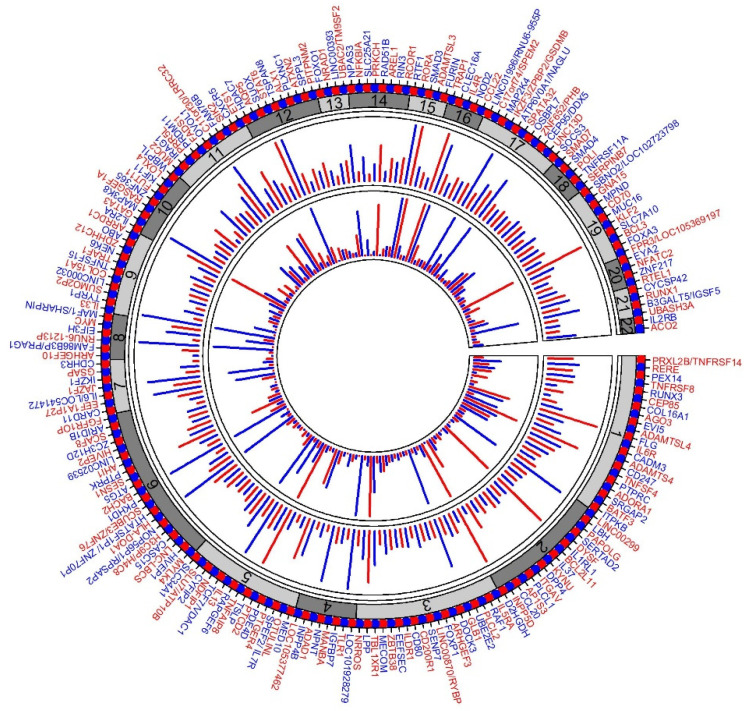
Figure 1.
Circular plot of 212 asthma loci. Plot summarizing the 212 asthma loci described in Han et al. [35]. The first (outer) track shows the gene(s) representing the loci in alternating colors (red and blue). The second track with alternating shades of grays represents the chromosomes. The third track represents the association p-value from the UKBB + TAGC meta-analysis; each line represents −log10P of the strongest signal in the loci (for clarity, lines are truncated to ≤25). The innermost track represents the replication of each locus. Asthma GWAS loci with significance association p-value < 5 × 10⁻⁸ were accessed from the GWAS Catalog ((https://www.ebi.ac.uk/gwas/home, accessed on 10 December 2021), and the number of hits for each loci was counted. All replications of 17q12-21 were merged to a single locus. The lengths of the lines show the number of hits (for clarity, lines are truncated for lengths up to 20).

