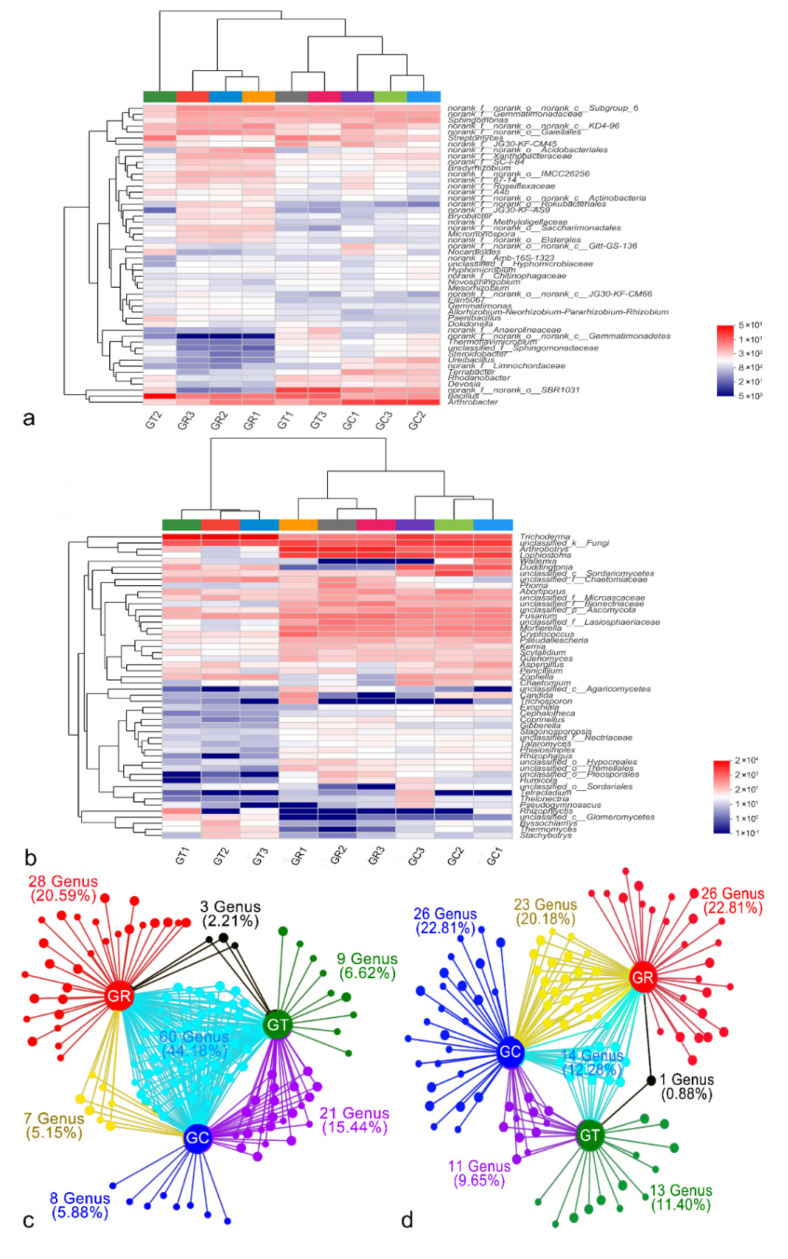
Figure 2.
Soil microbial community composition. Heatmaps showing differences in community structure of bacteria (a) and fungi (b) at the genus level. Collinearity network analysis in bacteria (c) and fungi (d) at the genus level based on species abundances greater than 50; the node sizes represent the relative abundance (square root) of the genus in the data set, and the edges represent the association patterns of individual genera with different treatments. The red nodes represent genera related to GR, the blue nodes represent genera related to GC, the green nodes represent genera related to GT, the yellow nodes represent genera related to GR and GC, the black nodes represent genera related to GR and GT, the purple nodes represent genera related to GT and GC, and the cyan nodes represent genera related to GR, GC, and GT.

