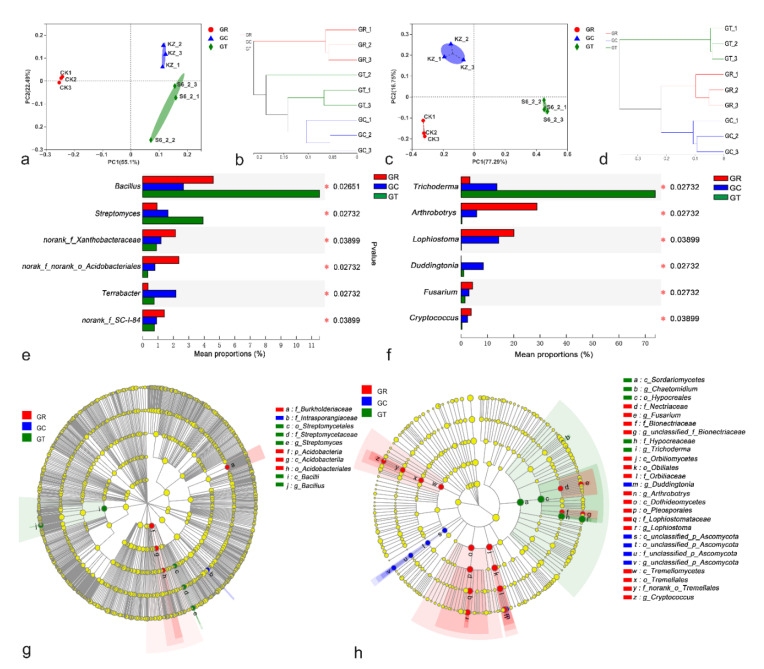
Figure 4.
Principal coordinate analysis (PCoA) of the Bray–Curtis distance matrix at the genus level for the bacterial (a) and fungal (c) communities. Circles, triangles, and diamonds represent the GR, GC, and GT samples. Hierarchical clustering analysis at the genus level for bacteria (b) and fungi (d). Statistical comparisons of the relative abundances of bacteria (e) and fungi (f) at the genus level in different groups were performed using the Kruskal–Wallis test. Cladograms showing the phylogenetic distribution of the bacterial (g) and fungal (h) lineages associated with the three treatments were generated by LEfSe analysis. Different colored regions represent different groups (red, GR; blue, GC; green, GT). Circles indicate phylogenetic levels from phylum to genus. The diameter of each circle is proportional to the abundance of the group.

