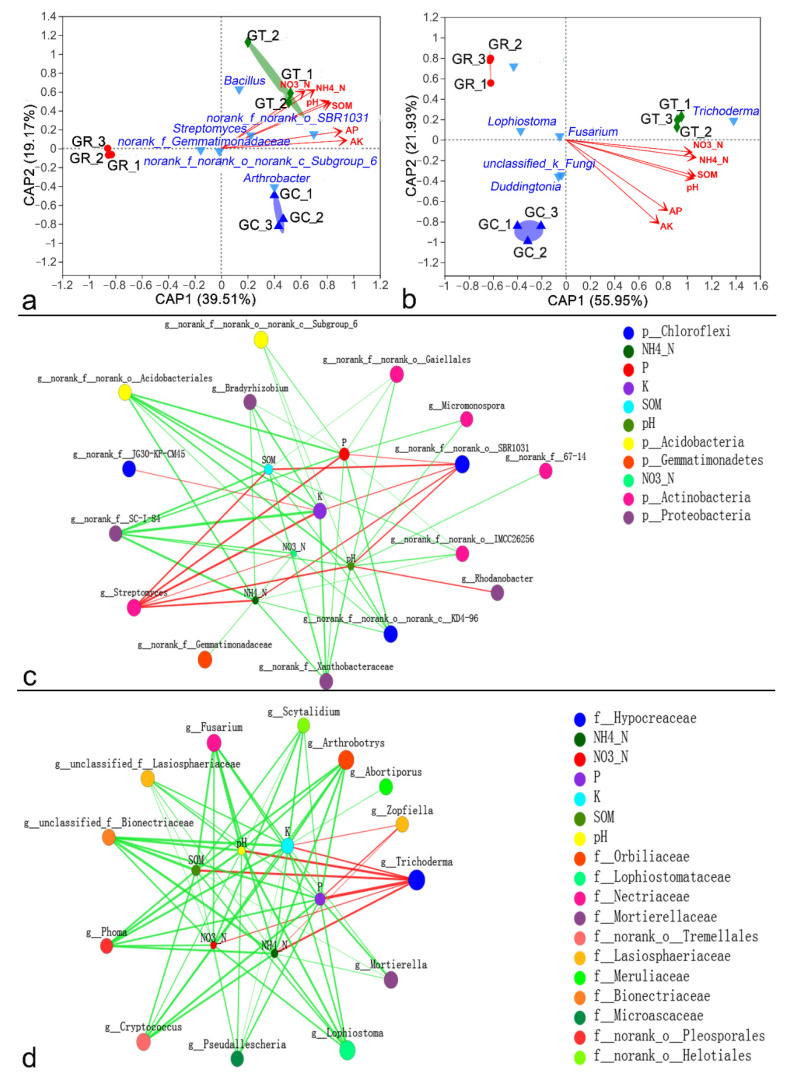
Figure 5.
Distance-based redundancy analysis (db-RDA) plot showing the relationships of environmental factors and treatments with bacterial (a) and fungal (b) community structure. The values on axes 1 and 2 are the percentages explained by each axis. Circles, upright triangles, and diamonds represent the GR, GC, and GT samples. The inverted triangles represent the top six microbial species in terms of abundance, and the red arrows represent environmental factors. Two-way correlation network analysis between environmental factors and the top twenty bacterial (c) and fungal (d) genera. The size of the node is proportional to the genus abundance and environmental factors. Node color corresponds to the family taxonomic classification. Edge colors represent positive (green) and negative (red) correlations, and the edge thickness is equivalent to the correlation magnitude.

