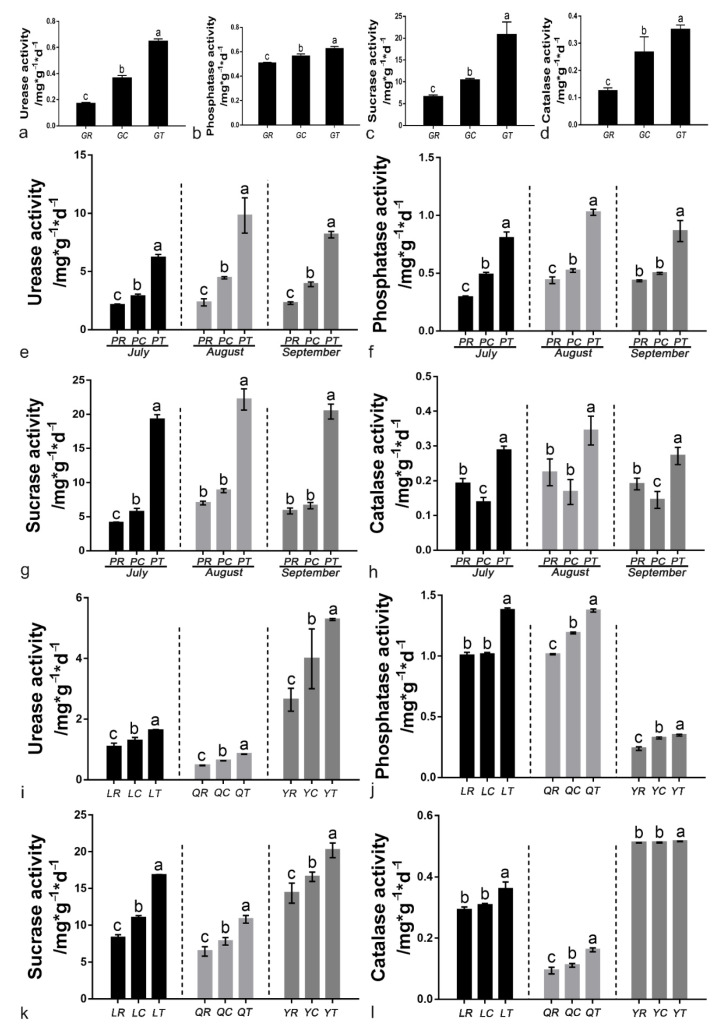
Figure 6.
Soil urease activity in the greenhouse experiment (a), pot experiment (e), and field experiment (i); soil phosphatase activity in the greenhouse experiment (b), pot experiment (f), and field experiment (j); soil sucrase activity in the greenhouse experiment (c), pot experiment (g), and field experiment (k); and soil catalase activity in the greenhouse experiment (d), pot experiment (h), and field experiment (l). Different lowercase letters (a,b,c) in the same column indicate a significant difference at p ≤ 0.05 level by Duncan’s new multiple range test.

