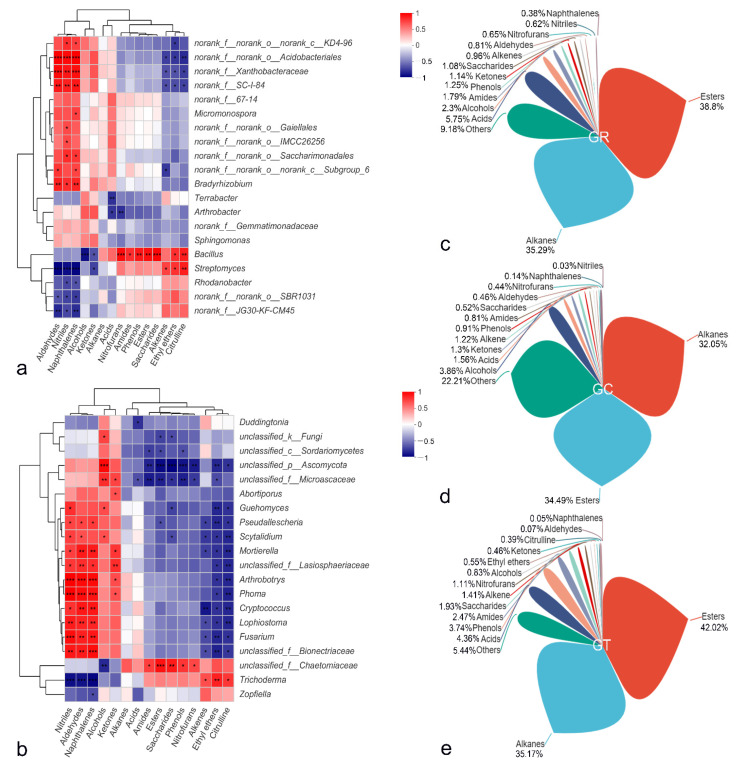
Figure 7.
Correlation heatmap of the top twenty bacterial (a) and fungal (b) genera with root exudates. The x and y axes are root exudates and genera. The legend shows the color range of the R values. Pie charts show the percentages of different root exudate components in GR (c), GC (d) and GT (e). Different colored petals represent different components. GR, control replant soil in the greenhouse experiment; GC, replant soil with blank carrier in the greenhouse experiment; GT, replant soil with 6S-2 fertilizer in the greenhouse experiment. * p ≤ 0.05, ** p ≤ 0.01, *** p ≤ 0.001.

