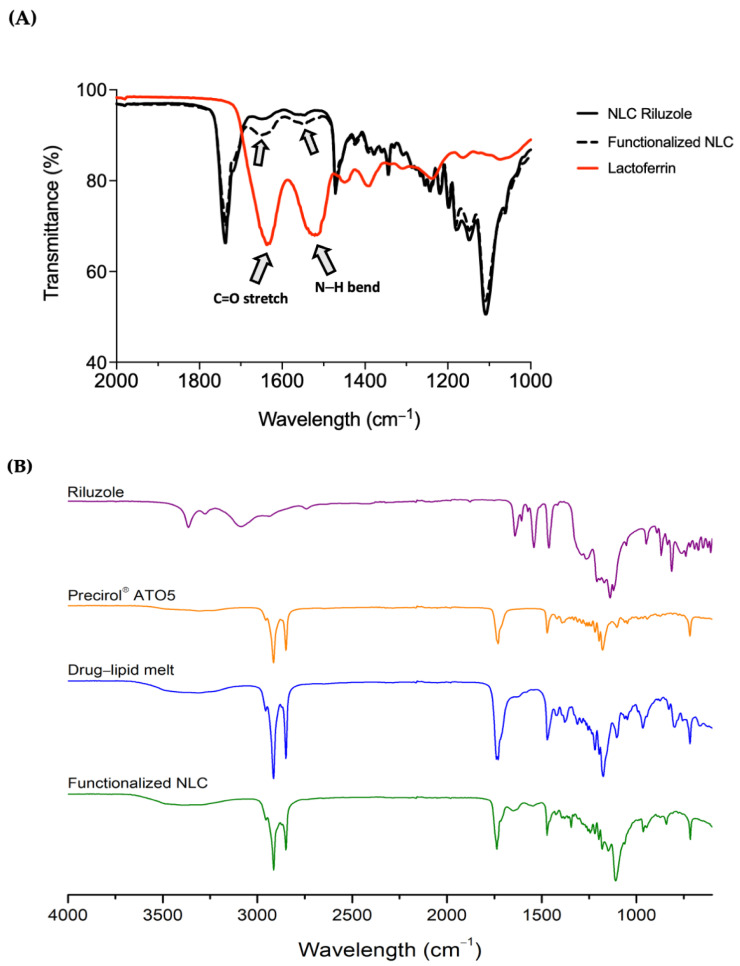
Figure 4.
(A) Infrared spectra for NLC before and after functionalization with Lf protein. Note: Lf was used as a reference to compare with the functionalized nanoparticles. To show the bands of interest, the wavelength scale was limited to the range of 1000 to 2000 cm−1; (B) full infrared spectra of riluzole, Precirol® ATO5, drug–lipid melt, and functionalized NLC.

