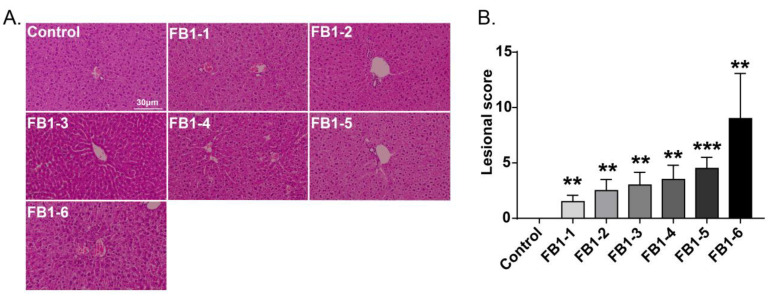
Figure 7.
Histological changes in the liver in mice exposed to different doses of FB1 for 8 weeks. (A) Typical histological picture in each group (HE. 200×). (B) Lesional score after histological examination based on the occurrence and severity of lesions. Values are shown as the mean ± SEM (n = 9). FB1-1 indicates 0.018 mg/kg BW, FB1-2 indicates 0.054 mg/kg BW, FB1-3 indicates 0.162 mg/kg BW, FB1-4 indicates 0.486 mg/kg BW, FB1-5 indicates 1.458 mg/kg BW and FB1-6 indicates groups 4.374 mg/kg BW; * indicates p < 0.05, ** indicates p < 0.01, *** indicates p < 0.001, vs. control group.

