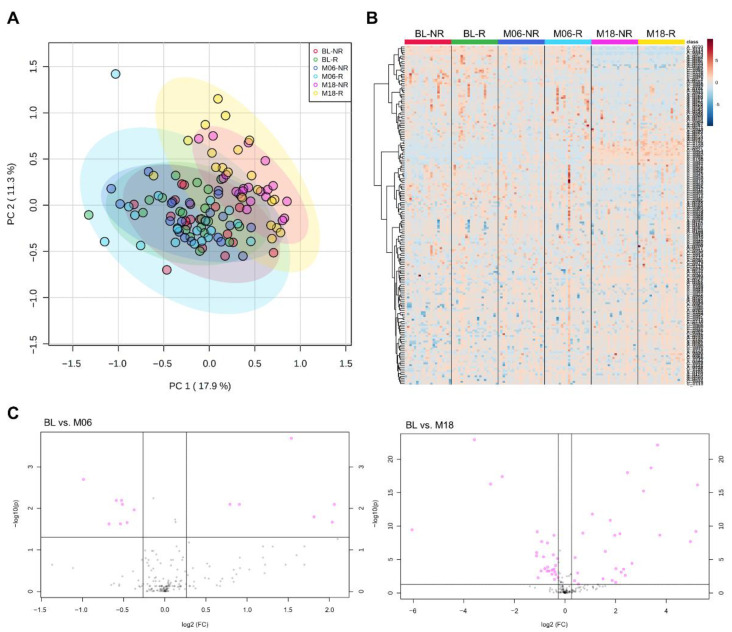
Figure 1.
Plasma metabolome profiles of the study population. (A) Principal component analysis and (B) hierarchical cluster analysis showing time-dependent metabolic changes by weight-loss interventions rather than responsiveness to the intervention. (C) Volcano plots of significant metabolites (FDR adjusted p-value < 0.05, fold change > 1.2) at 6 months and 18 months post-intervention compared to baseline.

