Figure 1.
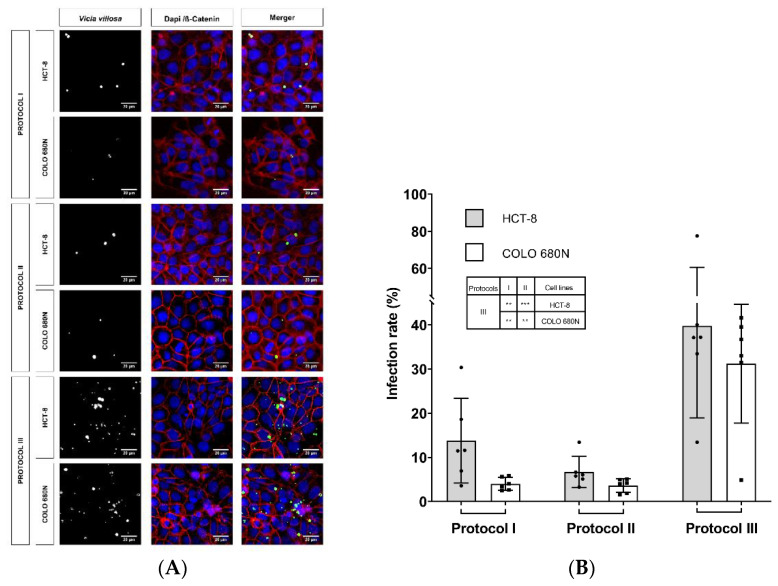
Exemplary illustration of Cryptosporidium parvum in vitro cell cultures at 24 hpi (A) Vicia villosa (VV) lectin-based detection of C. parvum (green), illustration of cell membranes via anti-β-catenin-mediated staining (red) and of cell nuclei via DAPI staining (blue). Scale bar 20 µm. (B) Infection rates of C. parvum-infected HCT-8 and COLO-680N cells after application of three different infection protocols. Infection rates are expressed as mean ± SD of six replicates per condition. For statistical analysis, a one-way analysis of variance (ANOVA) with Tukey’s test was performed using GraphPad® Prism 8 software (San Diego, CA, USA), with a significance level of 5%. The significance levels are as follows: *** = p ≤ 0.001, ** = p ≤ 0.01 and presented within the table in (B).

