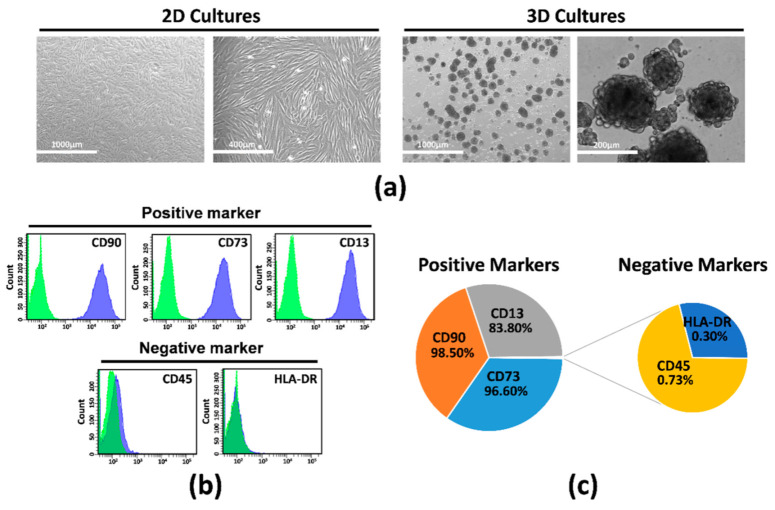
Figure 1.
Human amnion mesenchymal stem cells (hAMSCs) grown as both monolayer and spheroids. (a) Representative DIC images of hAMSCs grown in monolayer (2D cultures) or as spheroids (3D cultures). (b) Representative images of flow cytometry analysis for quantification of both positive and negative surface markers in hAMSCs at Passage 0. Green represents isotype control, and blue represents stained cells. (c) Graphic depicts the percentage of each marker. DIC, differential interference contrast.

