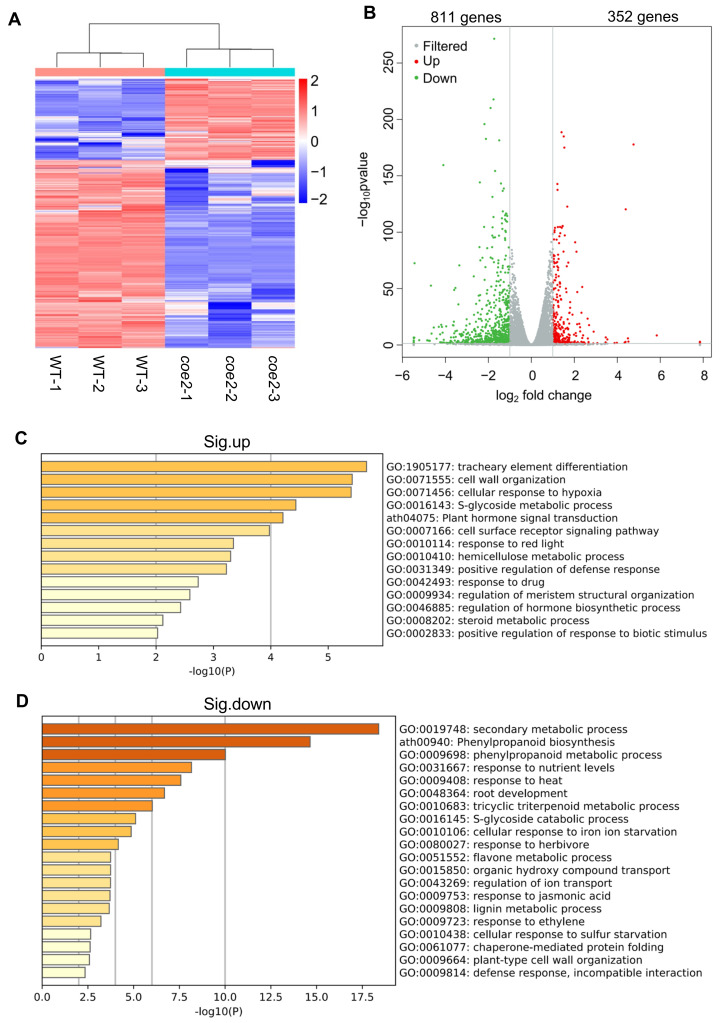
Figure 4.
Analysis of the differentially expressed genes (DEGs) in cotyledons of coe2 and WT. (A) Heatmap displays the expression pattern of the DEGs in cotyledons of coe2 and WT. (B) Volcano plot shows the distribution of the DEGs in cotyledons of coe2 and WT. Gene Ontology (GO) analysis of the up-regulated DEGs (C) and significantly down-regulated DEGs (D) in cotyledons of coe2, compared with WT.

