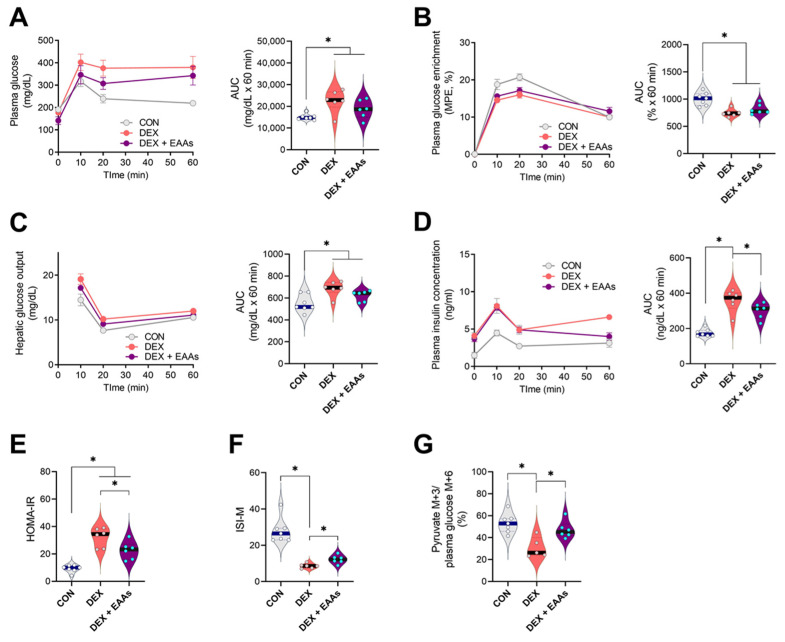
Figure 3.
The EAA-enriched diet improved impaired insulin sensitivity and glucose uptake in DEX-induced muscle atrophy. (A) Plasma glucose concentration during the oral glucose tolerance test (OGTT) (n = 6–7). (B) Plasma glucose enrichment during the OGTT (n = 6–7). (C) Hepatic glucose output during the OGTT (n = 6–7). (D) Plasma insulin concentrations during the OGTT (n = 6–7). (E) HOMA-IR (n = 6–7). (F) Matsuda insulin sensitivity index (n = 6–7). (G) GA muscle pyruvate M+3 to plasma glucose M+6 ratio (n = 6–7). Data are presented as mean ± S.E. * Significant difference between labeled groups (* p < 0.05). CON, control; DEX, dexamethasone; EAAs, essential amino acids; GA, gastrocnemius, MPE, mole percent excess; AUC; area under curve; HOMA-IR, homeostatic model assessment of insulin resistance; ISI-M, Matsuda-DeFronzo insulin sensitivity index.

