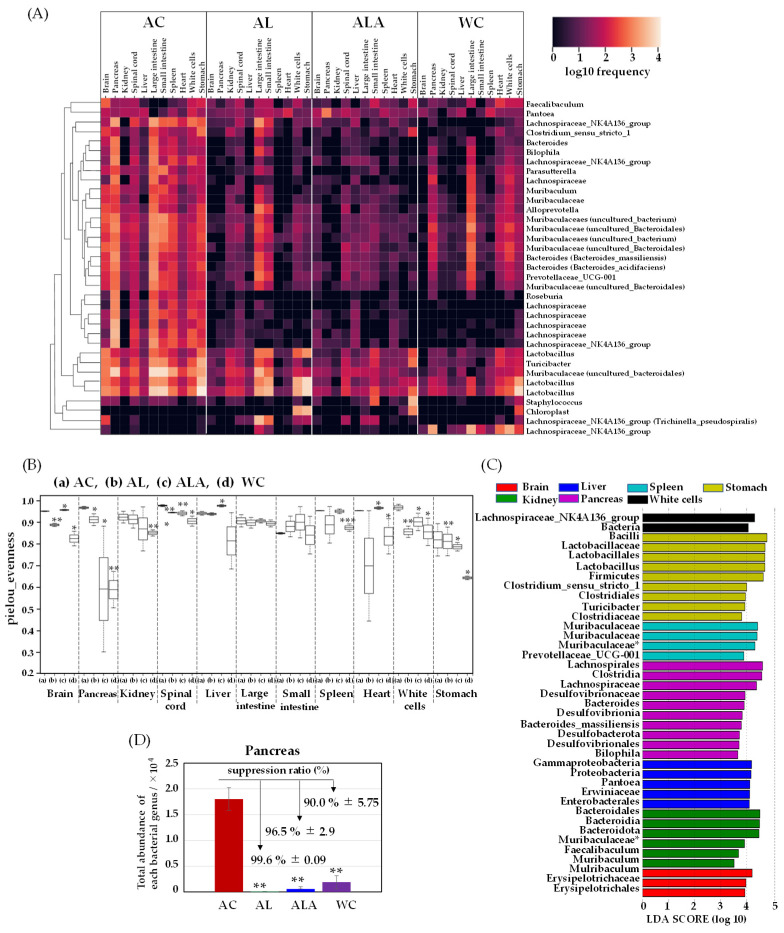
Figure 4.
A clustering analysis of bacteria in the mouse tissues (brain, pancreas, kidney, spinal cord, liver, large intestine, small intestine, spleen, heart, white cells, and stomach). Heatmap (A) and alpha diversity (B) of genus taxonomic categories identified by genomic analysis of 16S rRNA in tissues of mice aged 53 weeks (AC) or 64 weeks (AL, ALA, and WC mice). Data are plotted in comparison with the Alzheimer’s disease control (AC) mice for clarity; all tissues: n = 3/each, * p ≤ 0.05, ** p ≤ 0.01, *** p ≤ 0.001. (C) Histogram of the LDA scores (log10) > 3, p < 0.05 computed for features differentially abundant in the tissues of AC mice. (D) Total bacterial abundance ratio of genus taxonomic categories identified by genomic analysis of 16S rRNA in the pancreatic tissue of AD model mice aged 53 weeks (AC) or 64 weeks (AL, ALA, and WC). AD mice were fed limonoids alone (AL), L-arginine + limonoids (ALA), or the normal diet alone (AC). Wild-type mice were fed the normal diet alone (WC). * Bacteria with species-level taxonomic categories.

